About Chandra Archive Proposer Instruments & Calibration Newsletters Data Analysis HelpDesk Calibration Database NASA Archives & Centers Chandra Science Links


Background rates of the HRC

New: Mike Juda and Takashi Isobe have analyzed the HRC background including all the times that it is active. See "High Resolution Camera Stowed Background Study" for a description of the temporal behavior of the background rate, PHA distribution, and the particle environment. A method to create a background map for an observation is described in "How to Create a Background Map for an Observation".


The IPI team has developed a flagging/filtering tool to remove events which in their best judgement have incorrect spatial information. This filtering has the effect of reducing the background by approximately 40%, as well as eliminating the ghosting of sources (please see Steve Murray's memo on this effect). The most recent version as well as instructions and assesments of its performance can be found here. This tool is being implemented in the general processing software and should soon (sometime after 04/01/00) be applied to all data. This means that level 1 event files will have "bad" events flagged but not removed, while level 2 event files will have had the "bad" events removed.
Below are the current background rate analyses for the HRC-I and HRC-S.

The status of each is as follows:


HRC-I Background Rate


This is a plot of the measured total background rate from all sources- external and internal- for the HRC-I over the course of the first insertion of the HRC-I. The data run spans approximately 5.5 days (each major division is 1 day, each minor division is 2 hours).

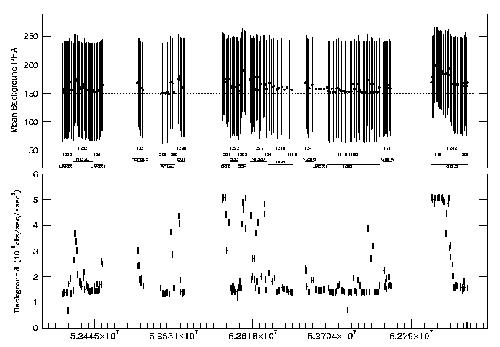
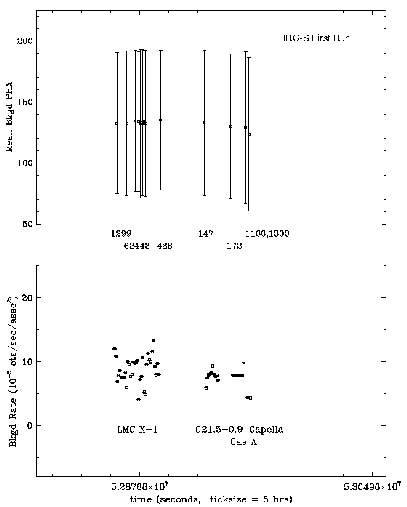
The quiescent rate is approximately 1.5E-5 counts/sec/arcsec**2, although there are regular excursions to rates 3-4 times higher than this. There is some correlation with the soft electron monitor in the EPHIN detector, it is however not one-to-one.

The data samples the entire MCP, with exclusions for obvious sources within the field. Approximately 40% of the background counts are directly removable based upon the characteristics of the amplitudes recorded in the three taps for each axis. This leaves a background count rate for the HRC-I of 9E-6 counts/sec/arcsec**2.

Also shown is the mean PHA and sigma of the distribution of mean PHA's. This distribution includes the above mentioned filterable background events, many of which lie in channel 255. NB: simply discarding events where the PHA=255 will not remove all of these events and is likely to discard source events.

Please note that this data was taken before the adjustment of the High Voltage which occurred on late September/early October 1999.


HRC-I Surface Distribution


Below are a set of plots demonstrating the shape of the overall background on the detector. They were made by first removing visible sources from 17 observations of AR-Lac. Then the data were blocked 8x8 in degapped pixels and then normalized with an exposure map. These results were then further smoothed using a Gaussian with a sigma of 40 blocked pixels, corresponding to 320 raw pixels or approximately 40 arcseconds.

We present three different views of these results: a 3-D projection of the count rate in absolute units, a relative contour plot of the count rate, and a percentage deviation from the mean.

Absolute Range Counts Percent Difference

Unfiltered

Unfiltered

Unfiltered

Filtered

Filtered

Filtered

Caveats

Custom Filtering

For Chandra users who wish to custom filter their data, we have compiled an event list containing the sum of all 17 observations used above. The event list has been filtered using the IPI software to flag all questionable events, but those events have not been removed from the list. A user can therefore filter the list as appropriate, bin it by 8 on both axes, and then divide the resulting image by our exposure map (also below).

To download, hold down the shift key and click on the links below.

Background Events List
(GZipped FITS format)
Exposure Map Image
(GZipped FITS format)


HRC-S Background Rate


Here are similar background rate results for the HRC-S, in imaging mode (i.e. without any grating in the beam). One obsid, which was very isolated temporally on this plot, has been dropped from the data for purposes of clarity[the
entire run is also available]. This data has been filtered to remove all events with PHA's of 0 and 255 (the top and bottom of the range) in a preliminary attempt to remove the background events mentioned above for the I. We note that due to the different gain characteristics of the S compared to the I it is unlikely that anything more than an insignificant number of source photons will have a PHA of 255.

In this case the "quiescent" partially filtered rate appears to be at least as high as the highest unfiltered rates for the I. The average rate, after partial filtering, is around 7.5E-5 counts/sec/arcsec**2, or nearly an order of magnitude greater than the I. This differential is due to the lack of a fully functional anti-coincidence shield on the S detector.
 

Contact CXC Calibration (cxccal@cfa.harvard.edu) for further information


Last modified:09/27/12


The Chandra X-Ray Center (CXC) is operated for NASA by the Smithsonian Astrophysical Observatory.
60 Garden Street, Cambridge, MA 02138 USA.    Email: cxcweb@head.cfa.harvard.edu
Smithsonian Institution, Copyright © 1998-2004. All rights reserved.