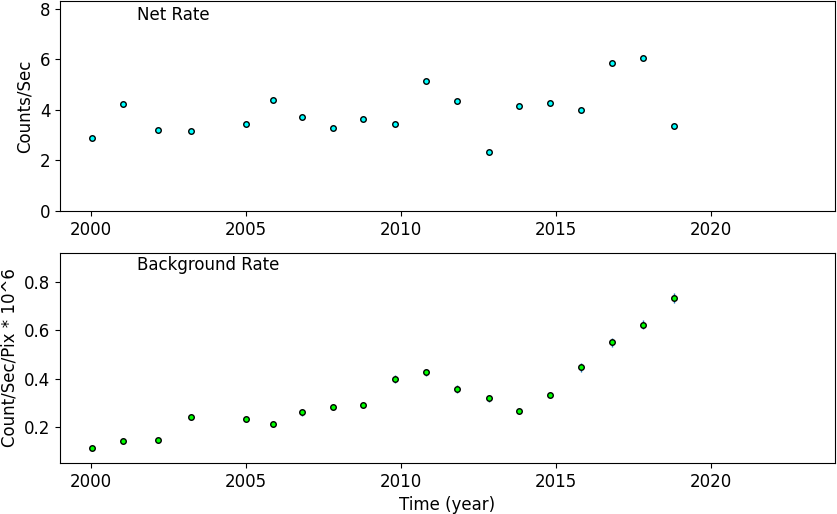
HRC I: PI Offset Position: [6, 0]

<<Location: [0, -4]    Location: [0, 6]>>
  
Back to Top Page

Hover the mouse over the data point on the plot below to see the information about the data point.
(Note: it may take a while to load the interactive plot.)

The fitted line on the popup window is a Gamma distribtuion:

g(x; k, θ) =
θk Γ(k)
xk-1 exp(-θ* x)
where k is the shape parameter and θ is the scale parameter. Shape parameter is defined by: (mean / sigma)2, and scale parameter id defined by: mean / sigma2.

HRC I: PI Offset Position: [6, 0]

Slope (before 2012): 1.184+/-0.539Slope (after 2012): -0.463+/-0.7502,0002,0022,0042,0062,0082,0102,0122,0142,0162,0182,0202,0222,0242,026406080100120140160180Time (year)PI

Open Fitted Distribution Page

HRC I: PI Offset Position: [6, 0] : Count Rate

Back to Top Page

If you have any questions about this page, please contact tisobe@cfa.harvard.edu.