HRC I: Scaled Sum Amp Offset Position: [10, 10]
Hover the mouse over the data point on the plot below to see the information about the data point.
(Note: it may take a while to load the interactive plot.)
The fitted line on the popup window is a Gamma distribtuion:
g(x; k, θ) =
θk Γ(k)
x
k-1 exp(-θ* x)
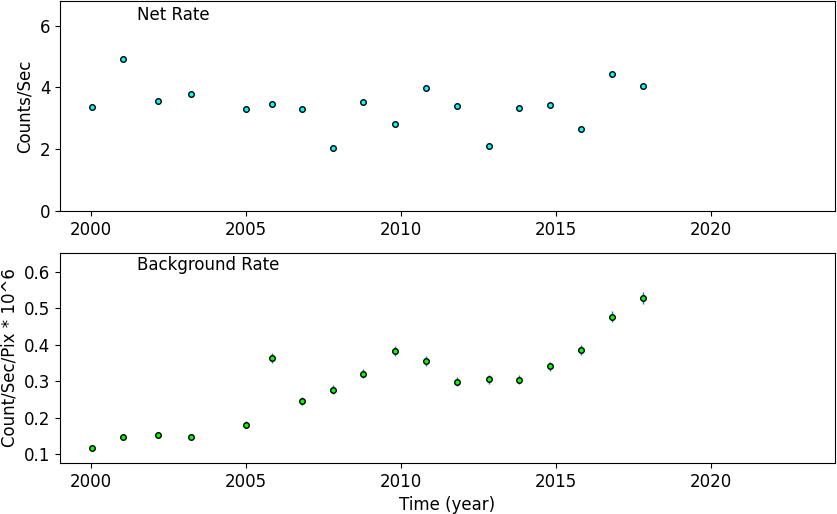
HRC I: Scaled Sum Amp Offset Position: [10, 10]
HRC I: Scaled Sum Amp Offset Position: [10, 10]
: Count Rate
If you have any questions about this page, please contact
tisobe@cfa.harvard.edu.