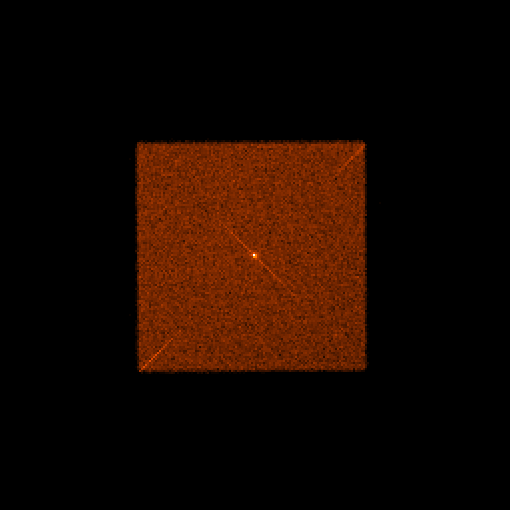

Example LETG observation images of HRC-I (left) and HRC-S(right).
The dispersion arms run from the bottom left to the center and then to the top right.
The dispersion runs from 50 to 70 Å for HRC-I and from 50Å to 170Å for
HRC-S.
Every year, HZ 43 is observed with gratings on both HRC-I and HRC-S. Recently, due to concern over the rapidly declining gain, the cadence has been increased to twice yearly. HZ 43 is usually observed with the gratings in place, so we can monitor how the count rates vary with wavelength.
Since HZ 43 is a point source, the center part is defined as a 200 pixel radius area around the source position. The unit is counts/sec (the background counts is normalized for per pixel; so the unit is counts/sec/pix.)
For the dispersion arm parts, HRC-I has enough data only in the wavelength 70-90Å cell to provide the decent statistics (more than 100 data points). On the other hand, HRC-S has enough data in the most of 10Å cells from 50Å to 170Å, separately for both +ve and -ve orders.
Since polygonal areas are used to estimate the count rates of each wavelength, the unit used on the dispersion arms is counts/sec/pixel.
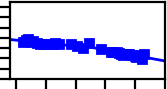
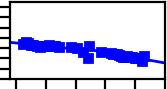
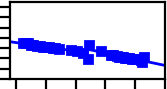
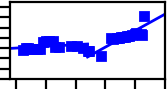
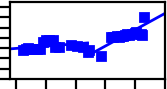
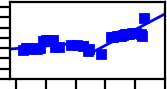
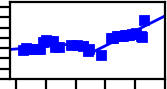
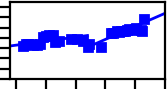
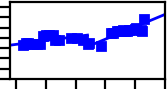
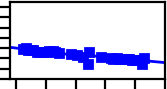
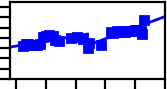
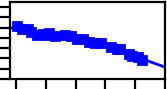
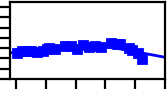
The tables blow list the links to the time trend of Scaled Sum Amp and PI, both positive and negative dispersion arms. The Scaled Sum Amp is defined by:
For the detail discussion about the Scaled Sum Amp, please see: Sumamps Gain Maps (J. Posson-Brown, V. Kashyap, 2009).
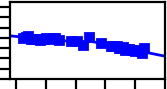
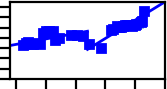
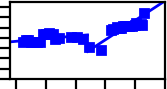
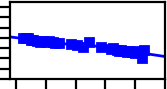
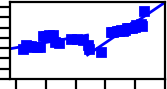
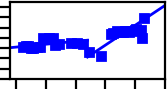
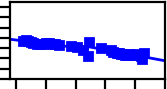
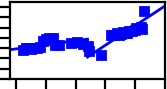
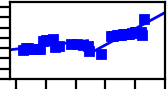
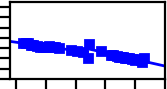
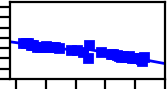
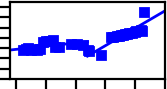
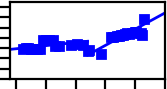
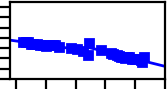
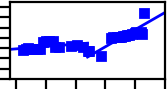
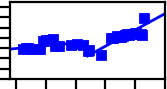
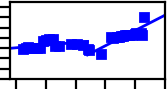
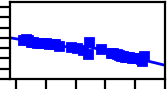
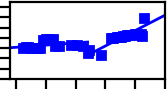
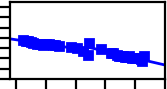
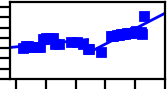
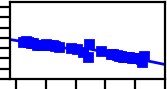
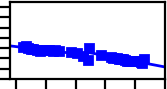
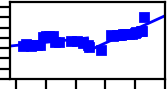
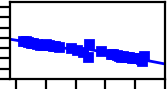
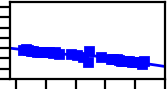
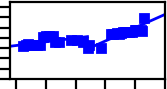
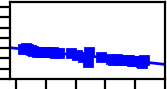
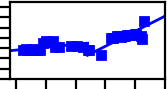
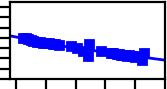
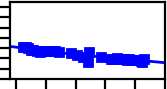
Since there is a discontinuity around year 2012, two lines are fitted before and after year 2012. If there are not enough data points, only one fitting is applied (the second slope is displayed as '0.000'). In the tables below, the top value is the slope before year 2012, and the bottom one is that of after year 2012.
To see the interactive trend plots, click a thumbnail plot in the table below.
| Scaled Sum Amp | PI | |||
|---|---|---|---|---|
| HRC-I |
|
-1.837+/-0.195 -4.198+/-0.290 |
|
1.103+/-0.175 -2.149+/-0.841 |
| HRC-S |
|
-1.001+/-0.140 -2.162+/-0.330 |
|
1.346+/-0.711 6.509+/-1.042 |
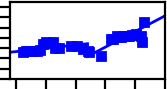
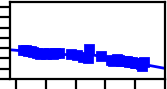
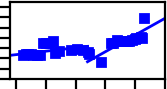
To see the interactive trend plots, click a thumbnail plot in the table below.
| Scaled Sum Amp | PI | |||||||
|---|---|---|---|---|---|---|---|---|
| Negative | Positive | Negative | Positive | |||||
| 60 - 80Å | 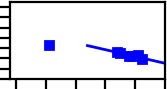 |
0.000+/-0.000 -2.647+/-0.550 | 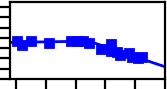 |
0.200+/-0.254 -3.907+/-0.790 | 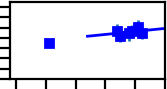 |
0.000+/-0.000 1.175+/-1.619 | 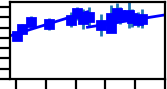 |
3.592+/-0.782 1.852+/-1.542 |
To see the interactive trend plots, click a thumbnail plot in the table below.
Note: the following values are used to estimate the dispersion positions in the arms.
Last modified: Jun 18, 2025.
If you have any questions, please contact swolk@cfa.harvard.edu