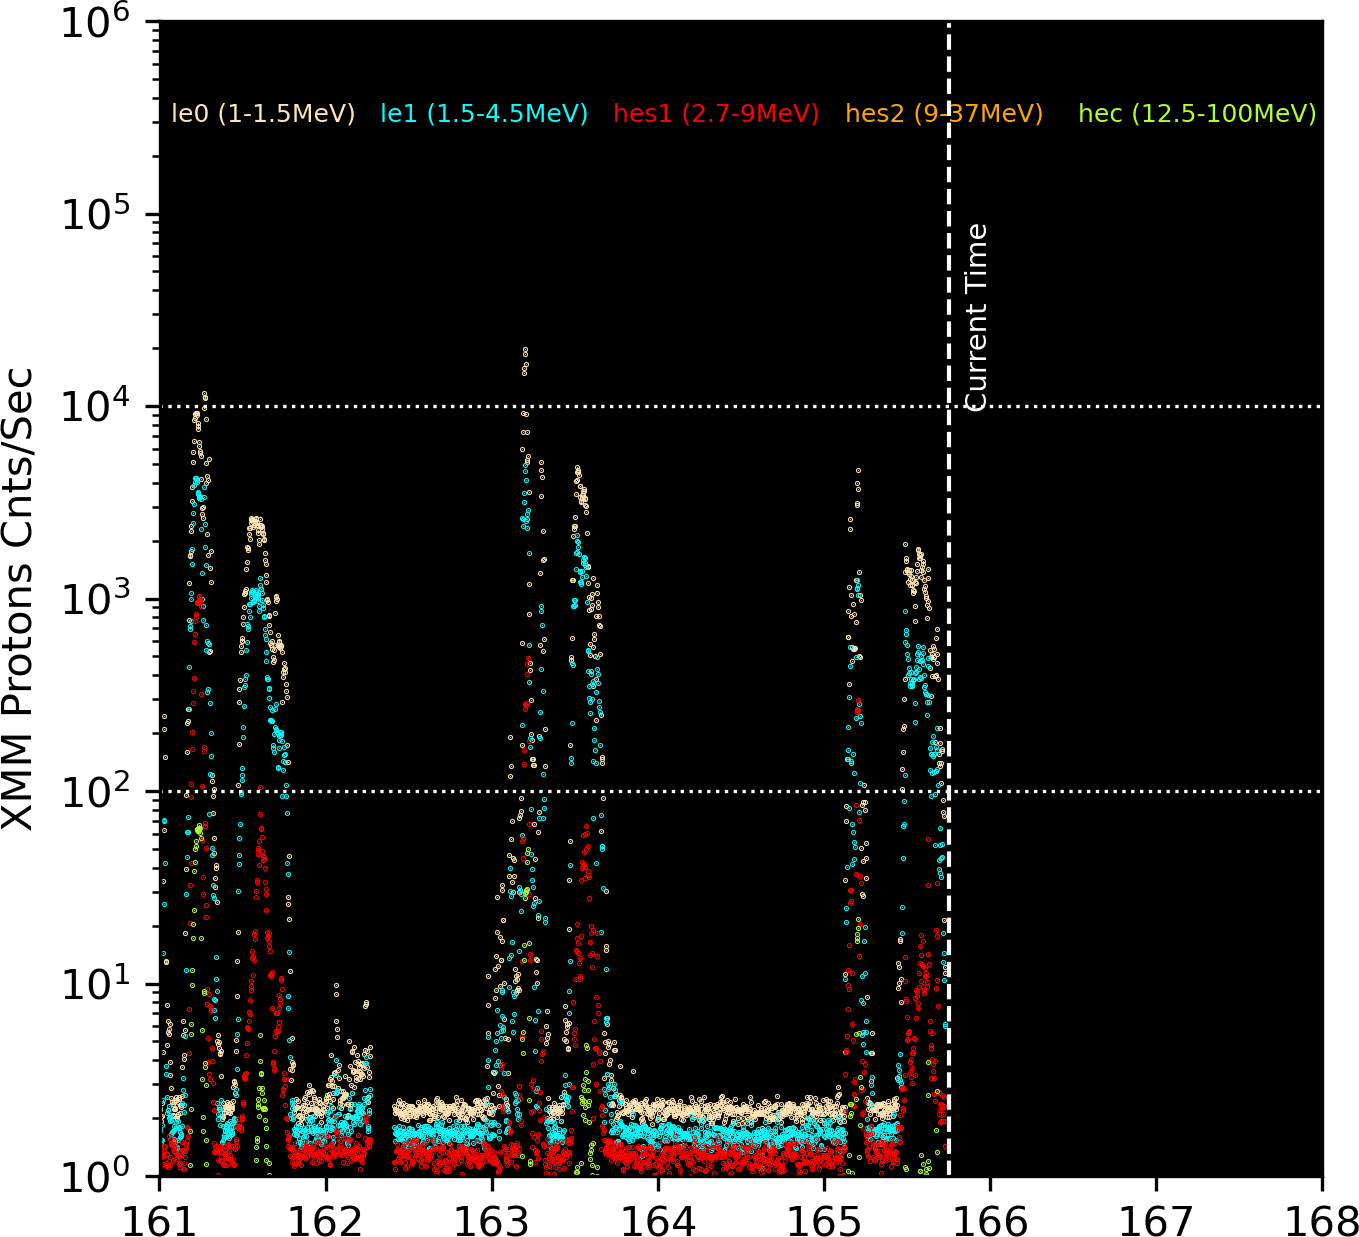
                                        Most recent XMM radiation observations
                                 Differential Flux particles/cm2-s-ster-MeV

 UT Date   Time    ---------------------------------- Protons MeV -------------------------------
                          LE1          LE2         HES1         HES2         HESC
  YR MO DA HHMM          1-1.5       1.5-4.5       2.7-9        9-37       12.5-100
2026-Jul22-15:30        1.916        0.460        1.549        0.495        0.379
2026-Jul22-16:30        1.924        0.440        1.496        0.466        0.390
2026-Jul22-17:30        1.955        0.484        1.455        0.434        0.395
2026-Jul22-18:30        1.956        0.427        1.532        0.493        0.382
2026-Jul22-19:30        1.896        0.445        1.481        0.475        0.406
2026-Jul22-20:30     7223.386     7221.860     7222.902     7221.867     7221.842
2026-Jul22-21:30        1.924        0.442        1.515        0.496        0.365
2026-Jul22-22:30        1.881        0.449        1.564        0.488        0.426
2026-Jul22-23:30        1.849        0.446        1.535        0.477        0.392
2026-Jul23-00:30        1.882        0.418        1.518        0.478        0.364
2026-Jul23-01:30        1.915        0.445        1.559        0.481        0.399
2026-Jul23-02:30        1.980        0.460        1.522        0.495        0.384
2026-Jul23-03:30        1.915        0.432        1.515        0.477        0.392
2026-Jul23-04:30        1.931        0.436        1.472        0.510        0.386
2026-Jul23-05:30        1.911        0.454        1.502        0.463        0.372
2026-Jul23-06:30        1.847        0.431        1.530        0.482        0.382
2026-Jul23-07:30        1.900        0.461        1.517        0.487        0.368
2026-Jul23-08:30        2.002        0.427        1.497        0.497        0.390
2026-Jul23-09:30        1.978        0.451        1.448        0.506        0.386
2026-Jul23-10:30        1.926        0.449        1.633        0.473        0.395
2026-Jul23-11:30        1.876        0.458        1.558        0.459        0.388
2026-Jul23-12:30        1.895        0.441        1.534        0.504        0.369
2026-Jul23-13:30        2.032        0.450        1.527        0.475        0.398
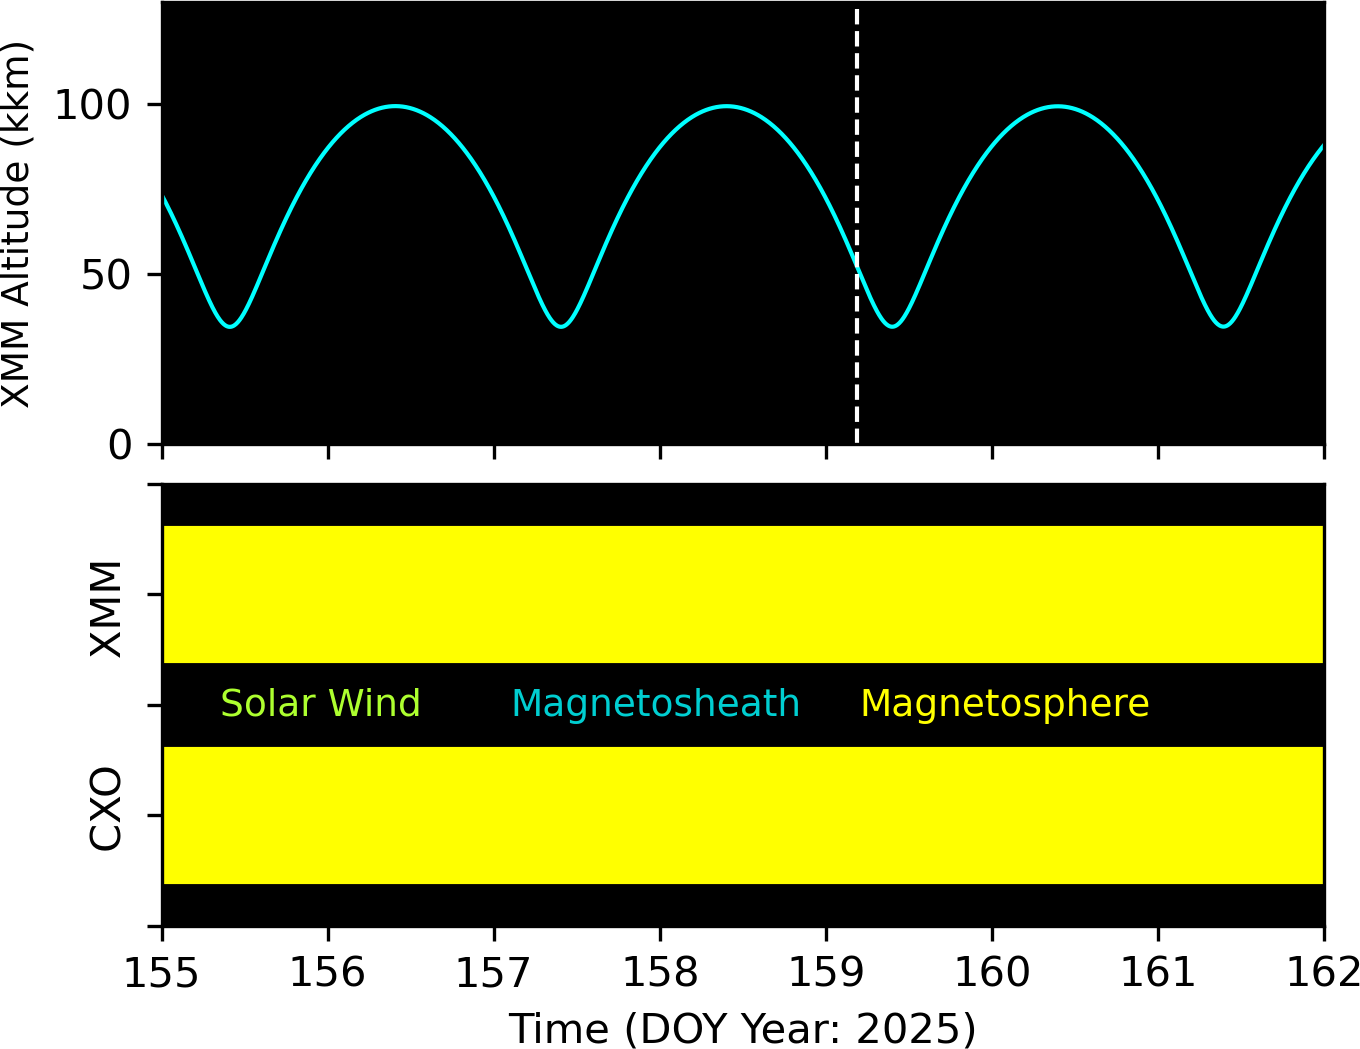
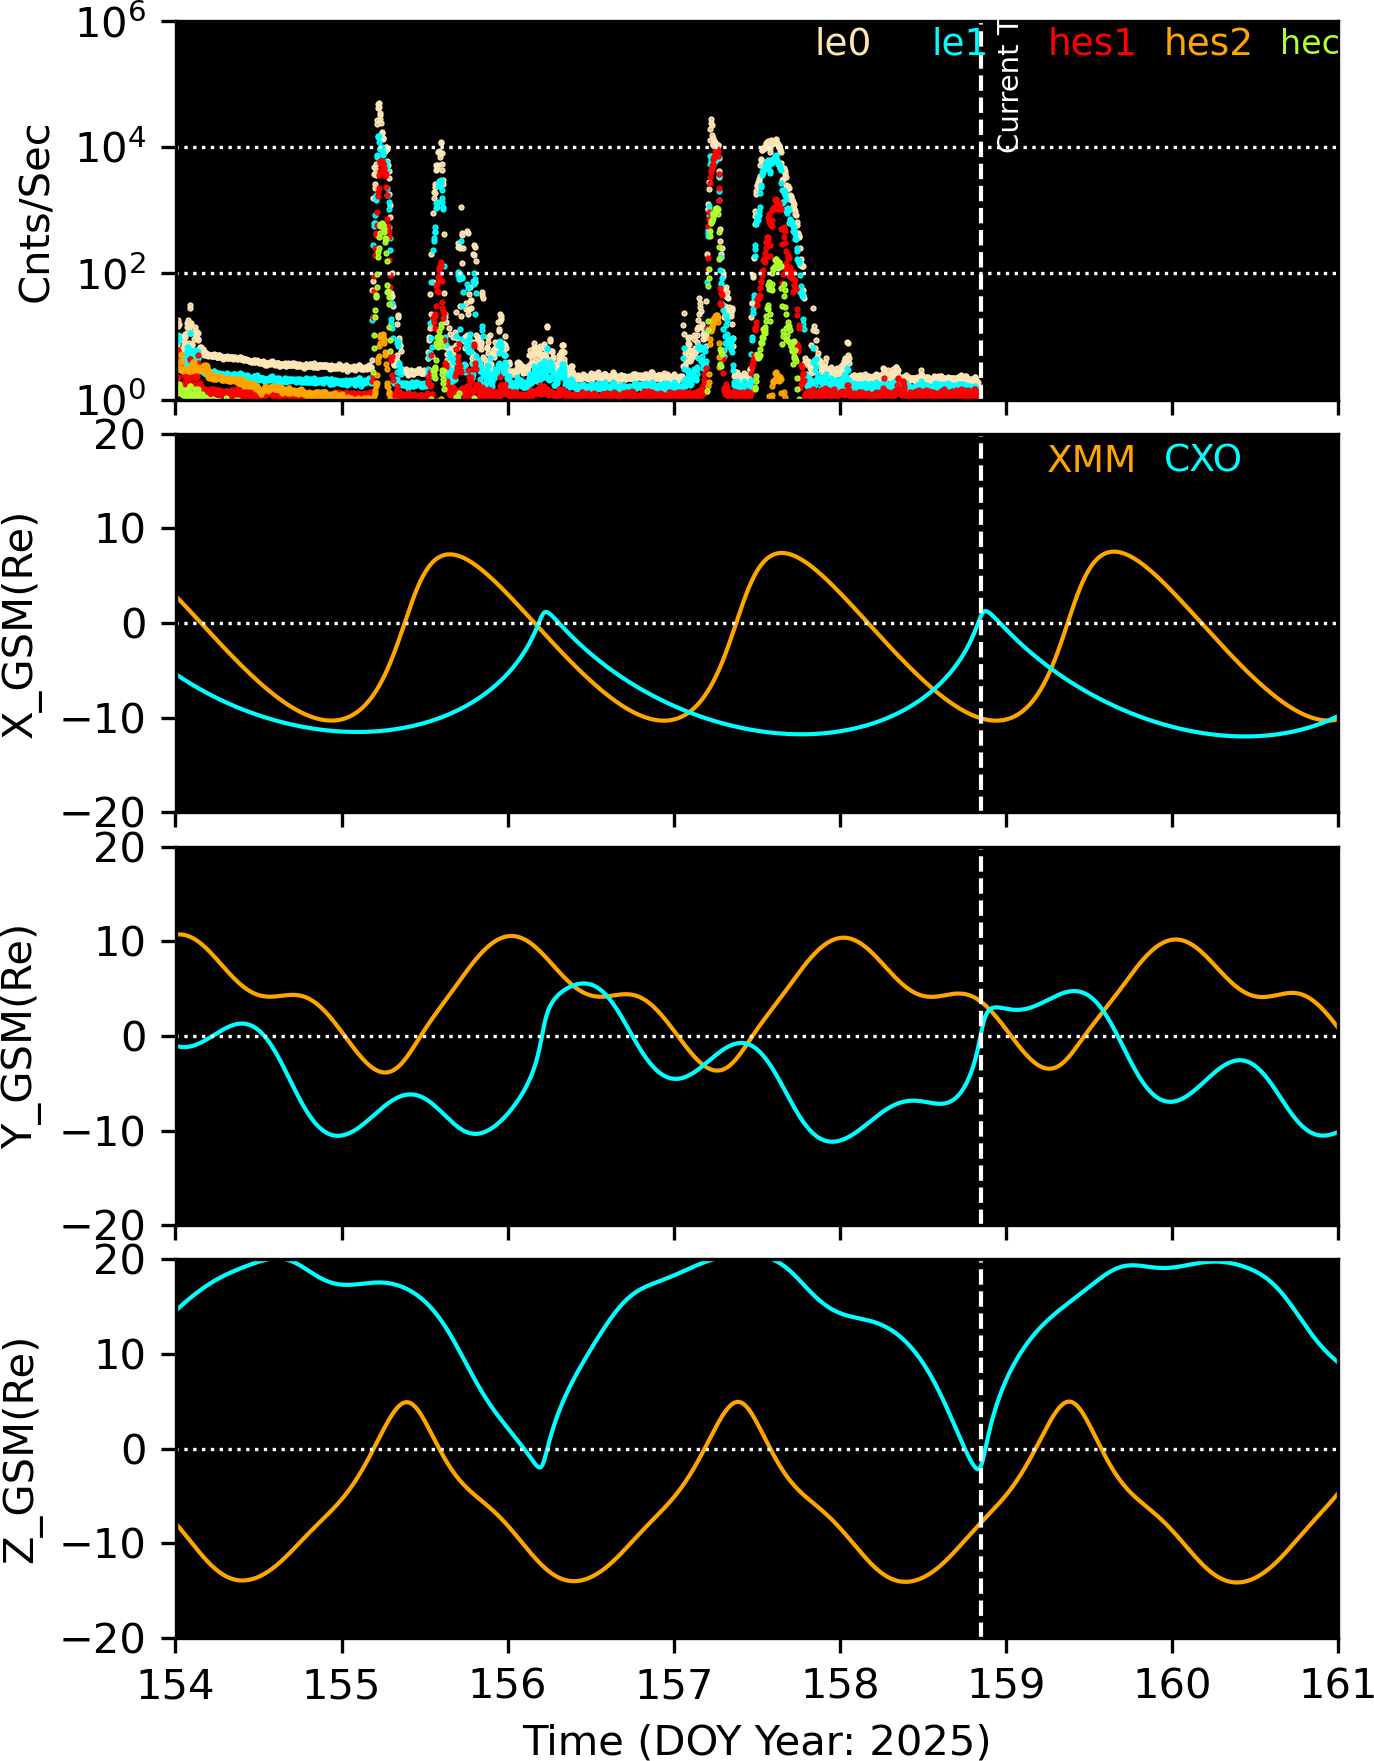
The following plots show the orbits of CXO and XMM in GSM coordinates. The left plot is in X-Y plane, and the right plot is in X-Z plane. If the orbit is in green, the satellite is in the solar wind area, if it is in light blue, the satellite is in magnetosheath, and if it is in yellow, the satellite is in magnetosphere.
The periods of the plotted orbits are +/-1.35 days from the current satellite positions (*), and the orange pentagon (*) mark the positions of one day ago.
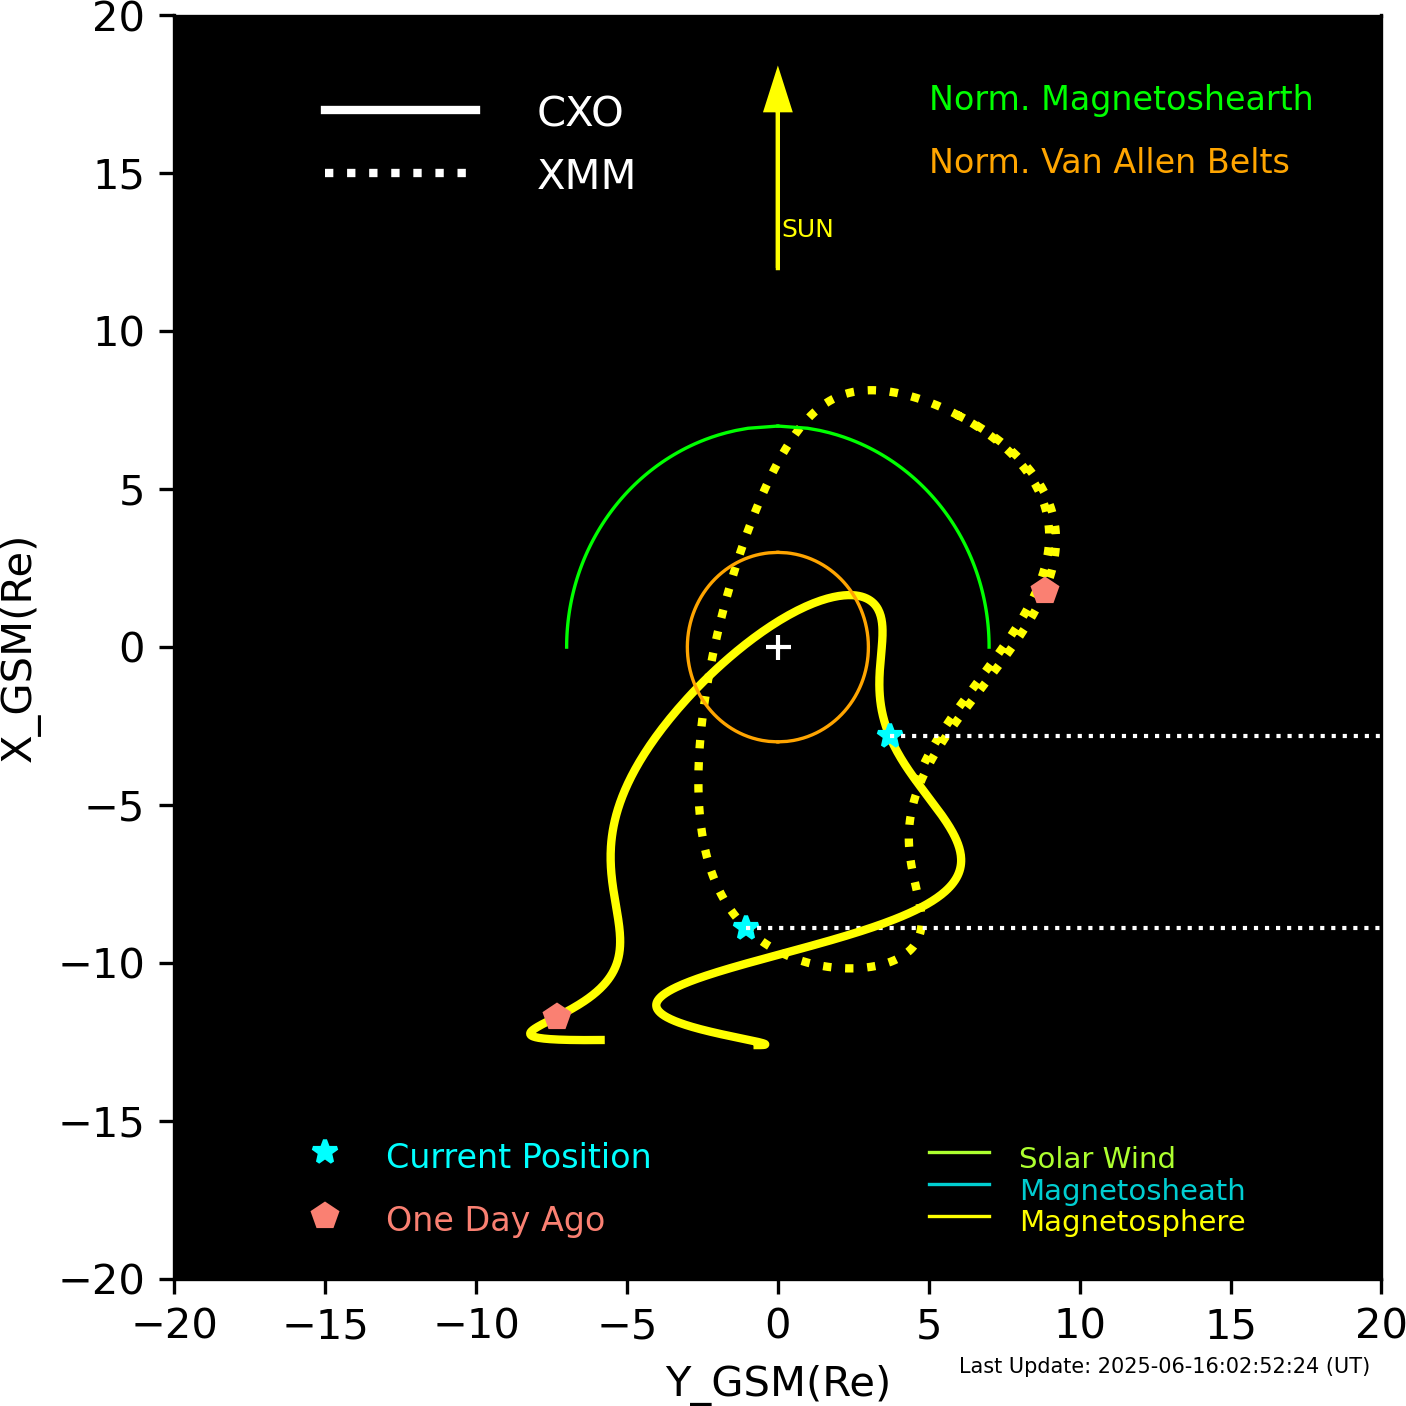
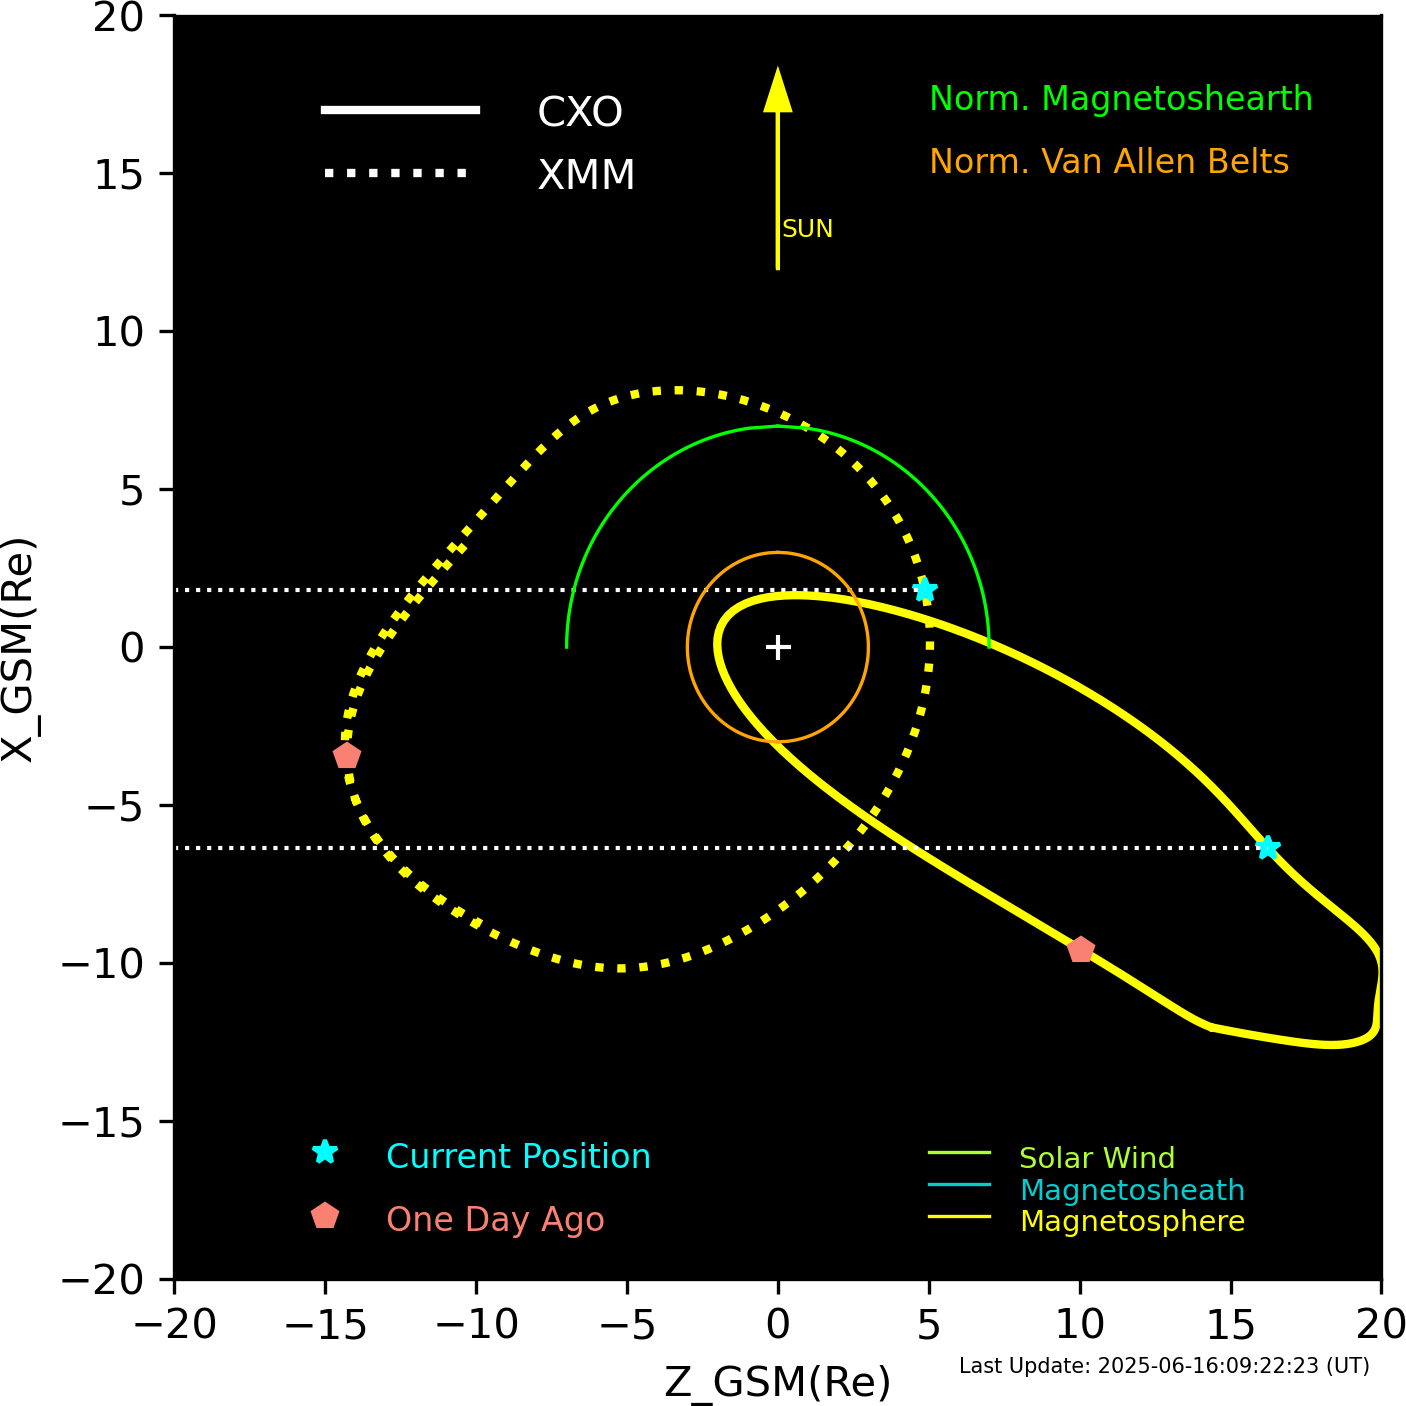
XMM and CXO orbits in GSM coordinates.
Email problems to: swolk
(Scott Wolk)
...it is all his fault