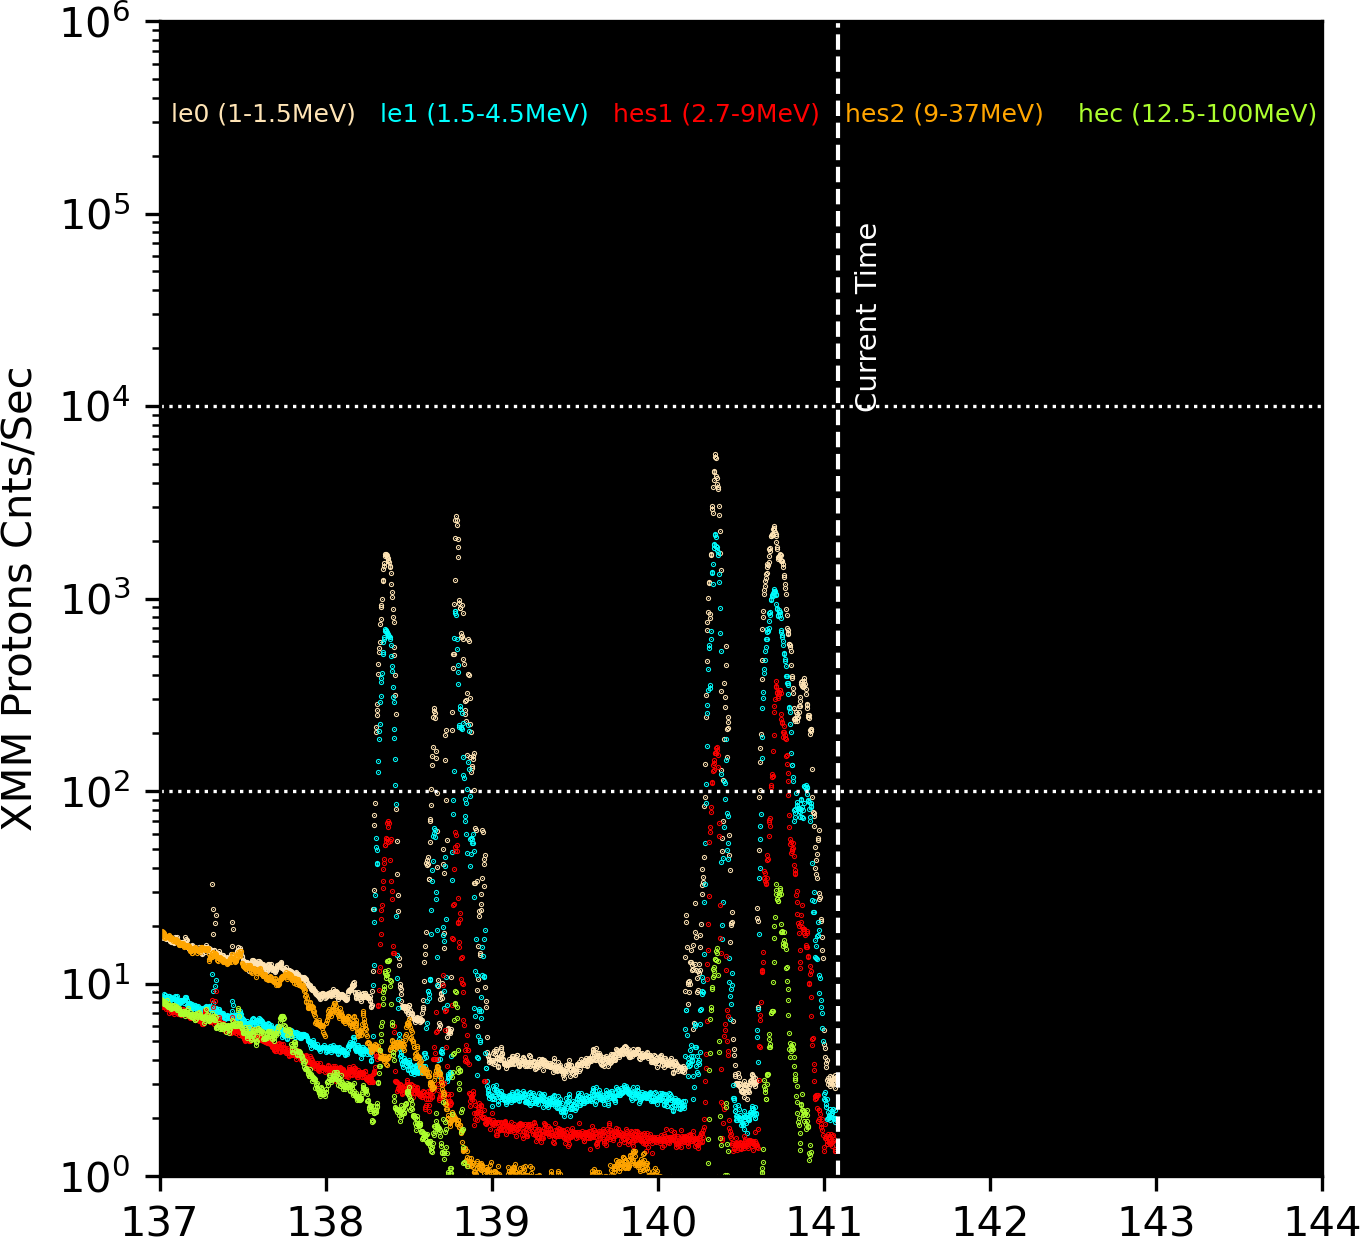
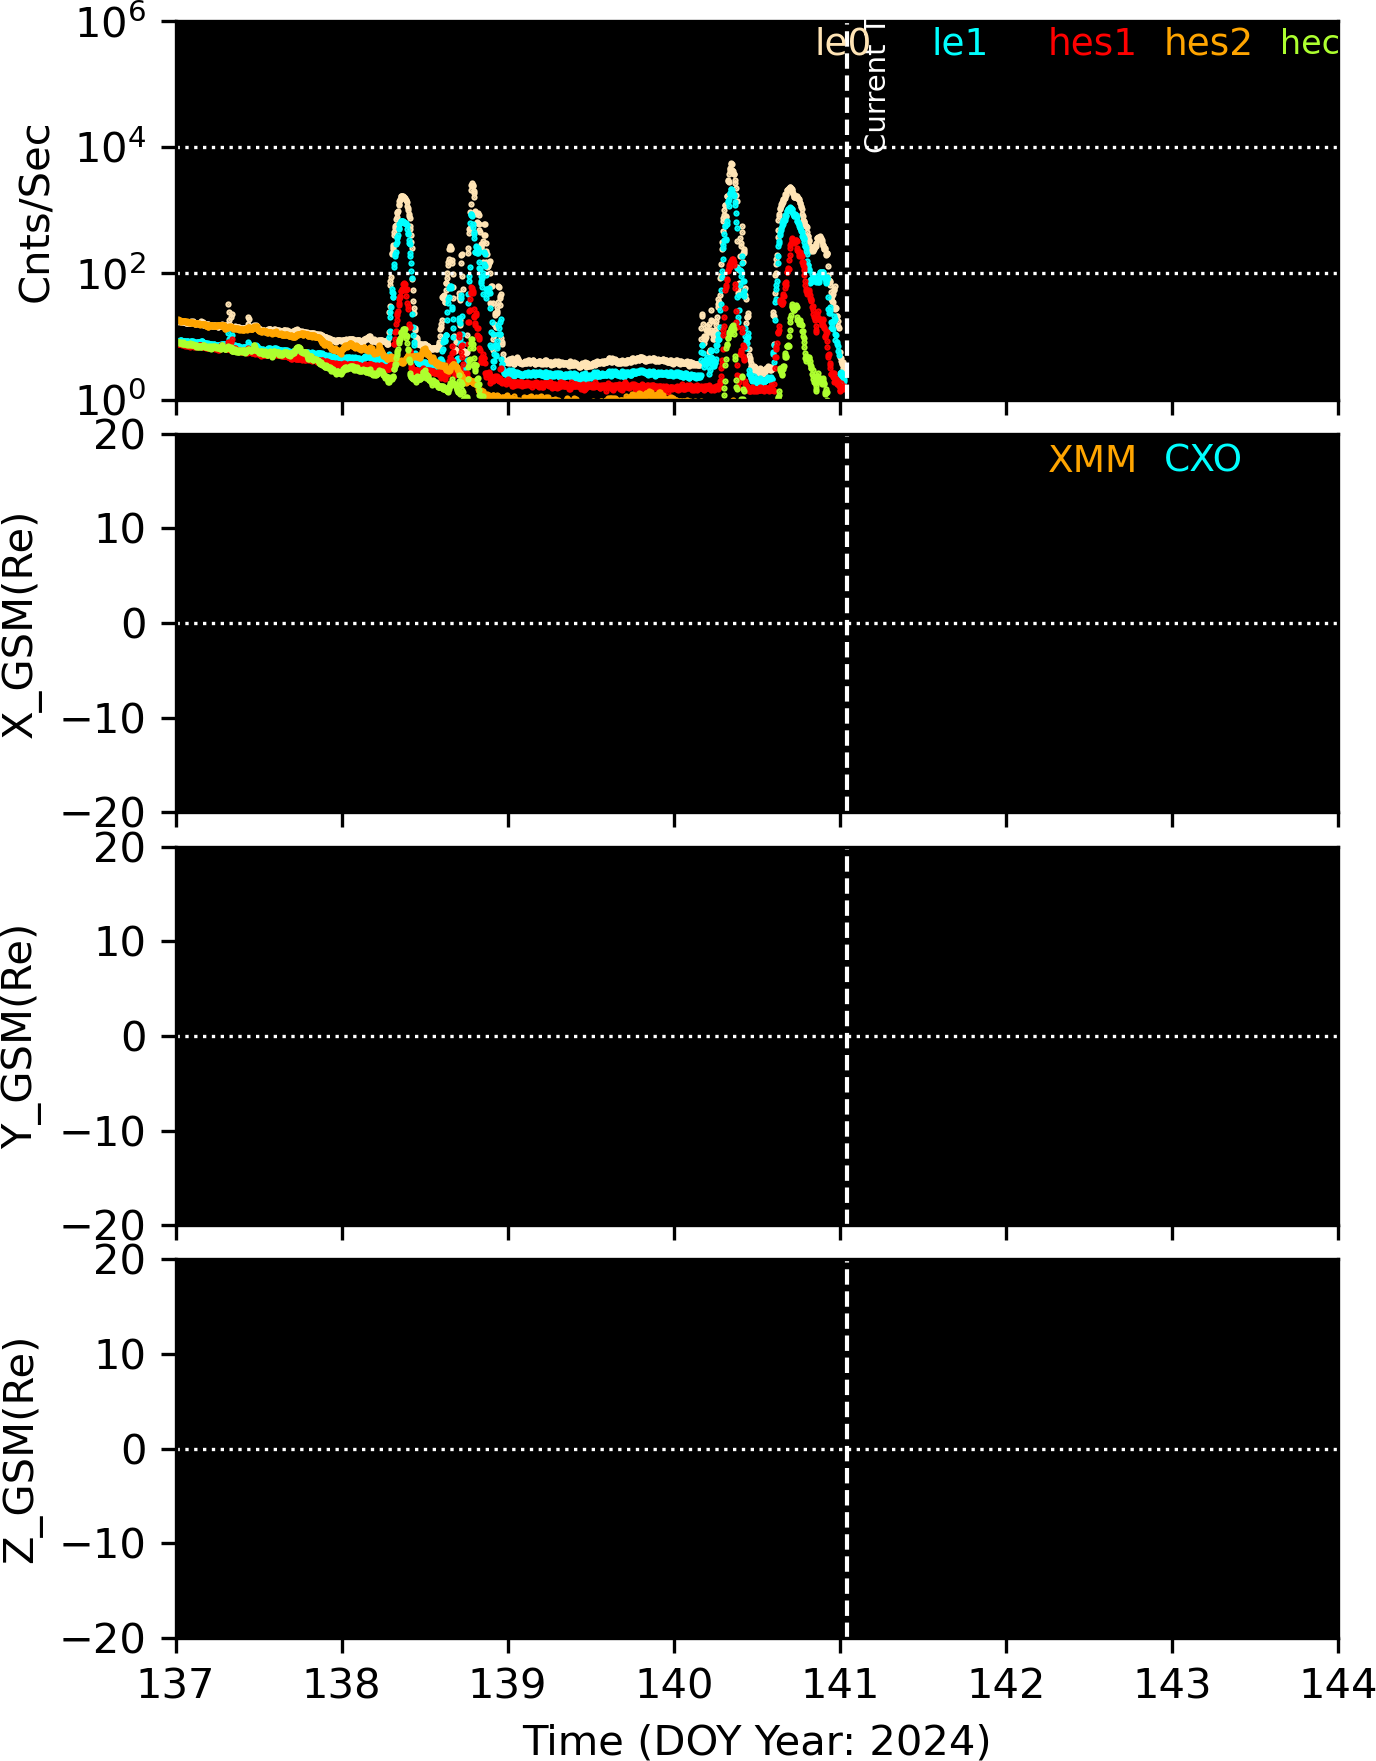
                                        Most recent XMM radiation observations
                                 Differential Flux particles/cm2-s-ster-MeV

 UT Date   Time    ---------------------------------- Protons MeV -------------------------------
                          LE1          LE2         HES1         HES2         HESC
  YR MO DA HHMM          1-1.5       1.5-4.5       2.7-9        9-37       12.5-100
2024-May17-03:30        4.752        1.449        3.465        6.331        2.898
2024-May17-04:30        4.706        1.441        3.459        5.978        2.625
2024-May17-05:30        4.453        1.464        3.365        6.080        2.747
2024-May17-06:30        5.365        1.154        3.200        4.707        2.239
2024-May17-07:30      120.015        1.074        7.634        4.557        2.951
2024-May17-08:30      584.502        0.992       44.882        4.059        9.579
2024-May17-09:30      460.825        1.056       35.026        4.638        7.612
2024-May17-10:30       29.028        1.164        2.983        4.830        2.185
2024-May17-11:30        3.847        1.374        2.864        5.421        2.399
2024-May17-12:30        3.626        1.335        2.823        5.232        2.264
2024-May17-13:30        3.601        1.090        2.708        4.048        1.818
2024-May17-14:30        5.813        0.938        2.531        3.489        1.567
2024-May17-15:30       36.733        0.894        3.700        3.107        1.609
2024-May17-16:30        8.006        0.943        4.126        3.302        1.717
2024-May17-17:30       12.159        0.784        3.619        2.223        1.272
2024-May17-18:30      370.878        0.716       30.743        1.989        5.011
2024-May17-19:30      256.619        0.659       15.668        1.702        2.625
2024-May17-20:30      102.229        0.601        3.985        1.242        0.886
2024-May17-21:30       31.017        0.587        2.312        1.109        0.699
2024-May17-22:30        9.655        0.628        2.296        1.065        0.666
2024-May17-23:30        3.027        0.667        1.909        1.061        0.588
2024-May18-00:30        2.652        0.697        1.848        0.996        0.591
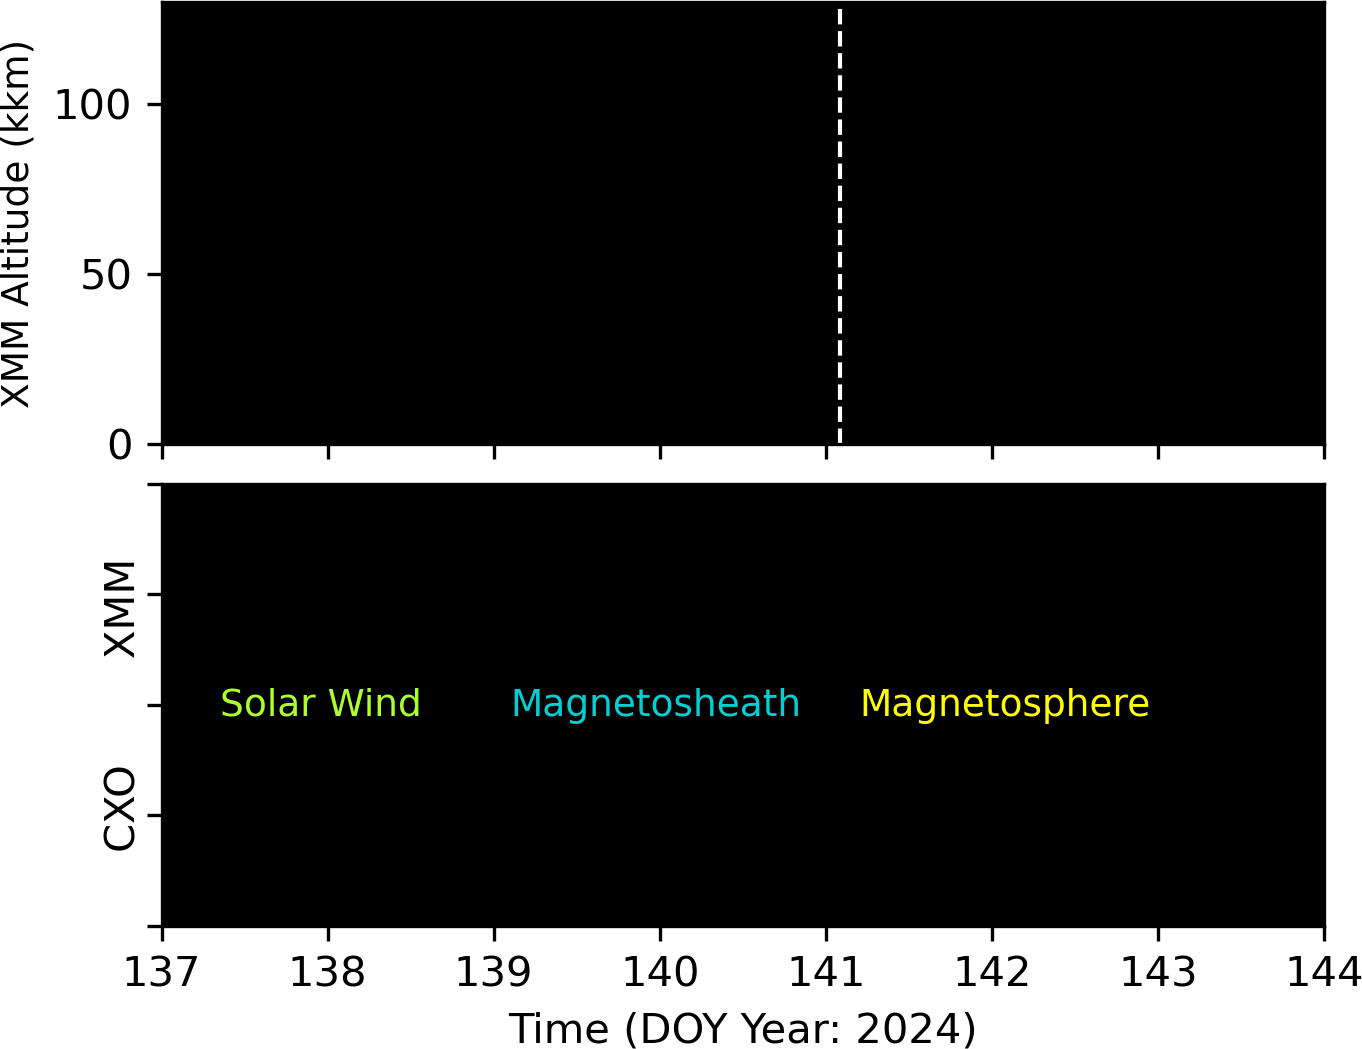
The following plots show the orbits of CXO and XMM in GSM coordinates. The left plot is in X-Y plane, and the right plot is in X-Z plane. If the orbit is in green, the satellite is in the solar wind area, if it is in light blue, the satellite is in magnetosheath, and if it is in yellow, the satellite is in magnetosphere.
The periods of the plotted orbits are +/-1.35 days from the current satellite positions (*), and the orange pentagon (*) mark the positions of one day ago.
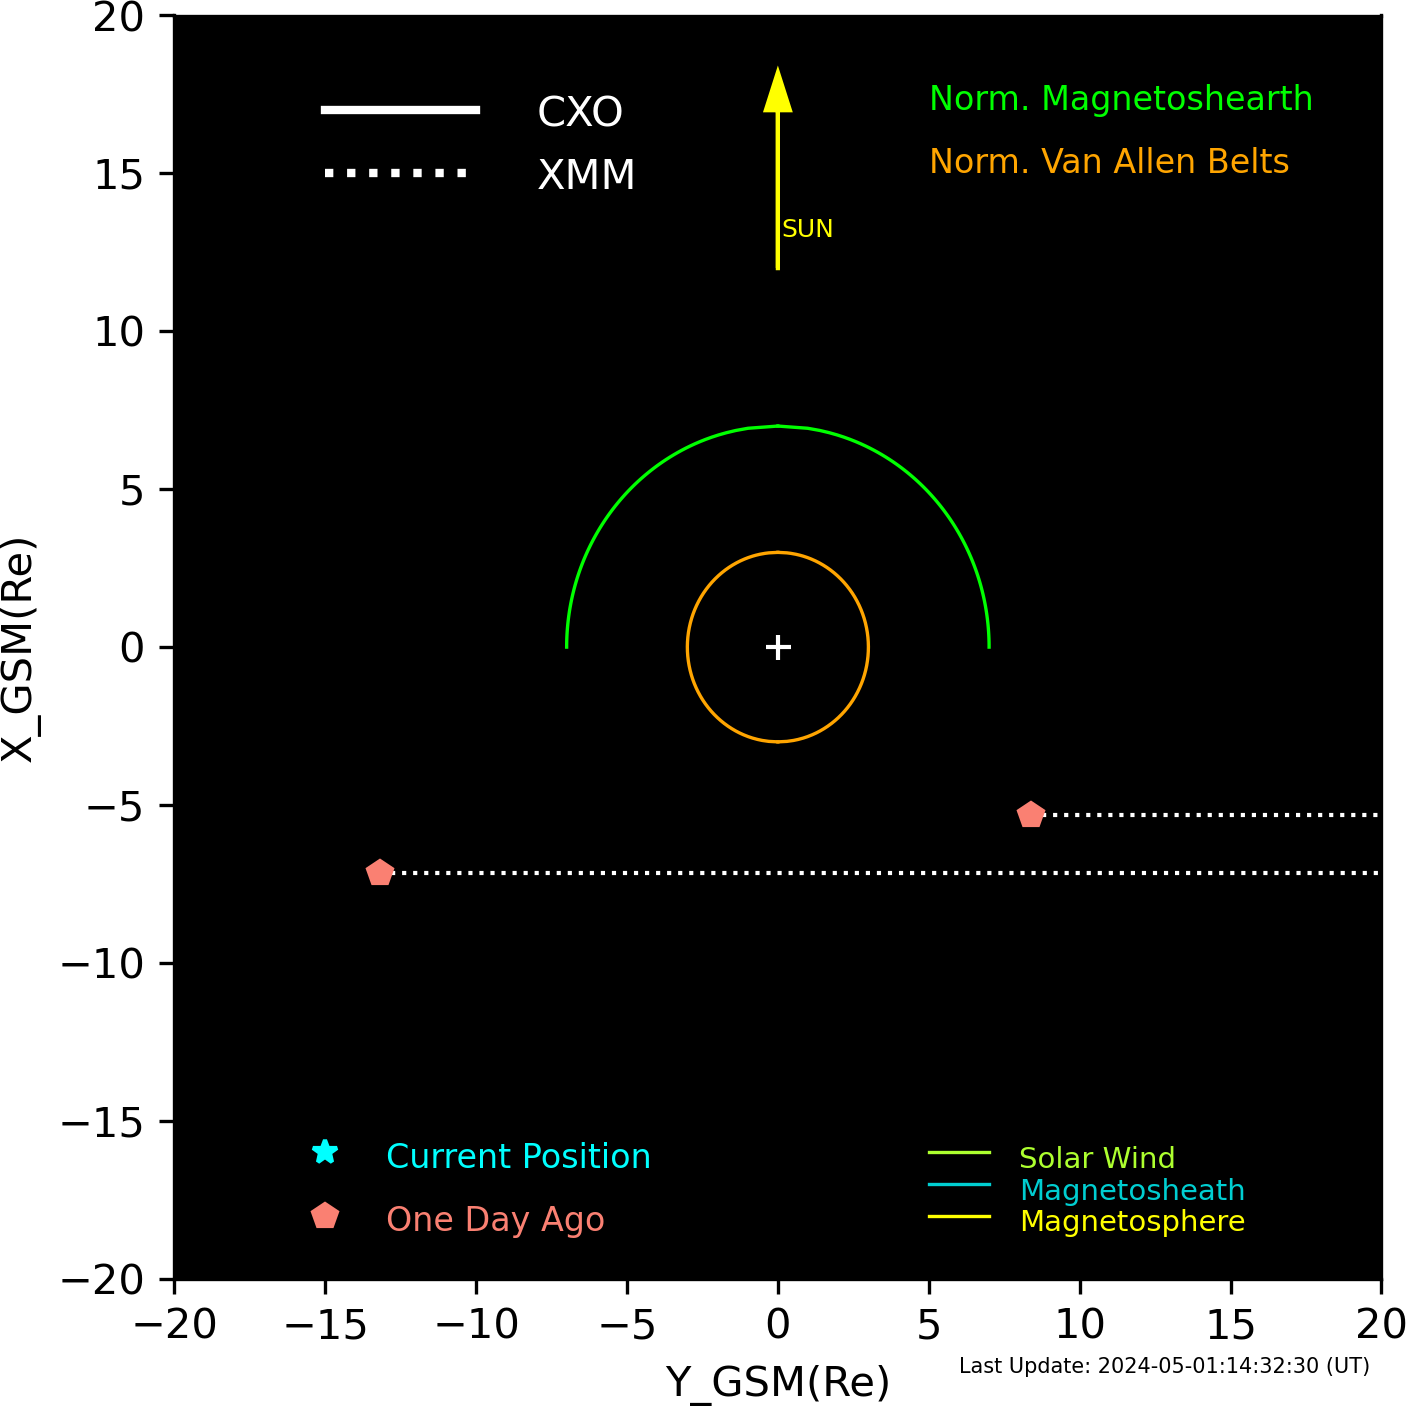
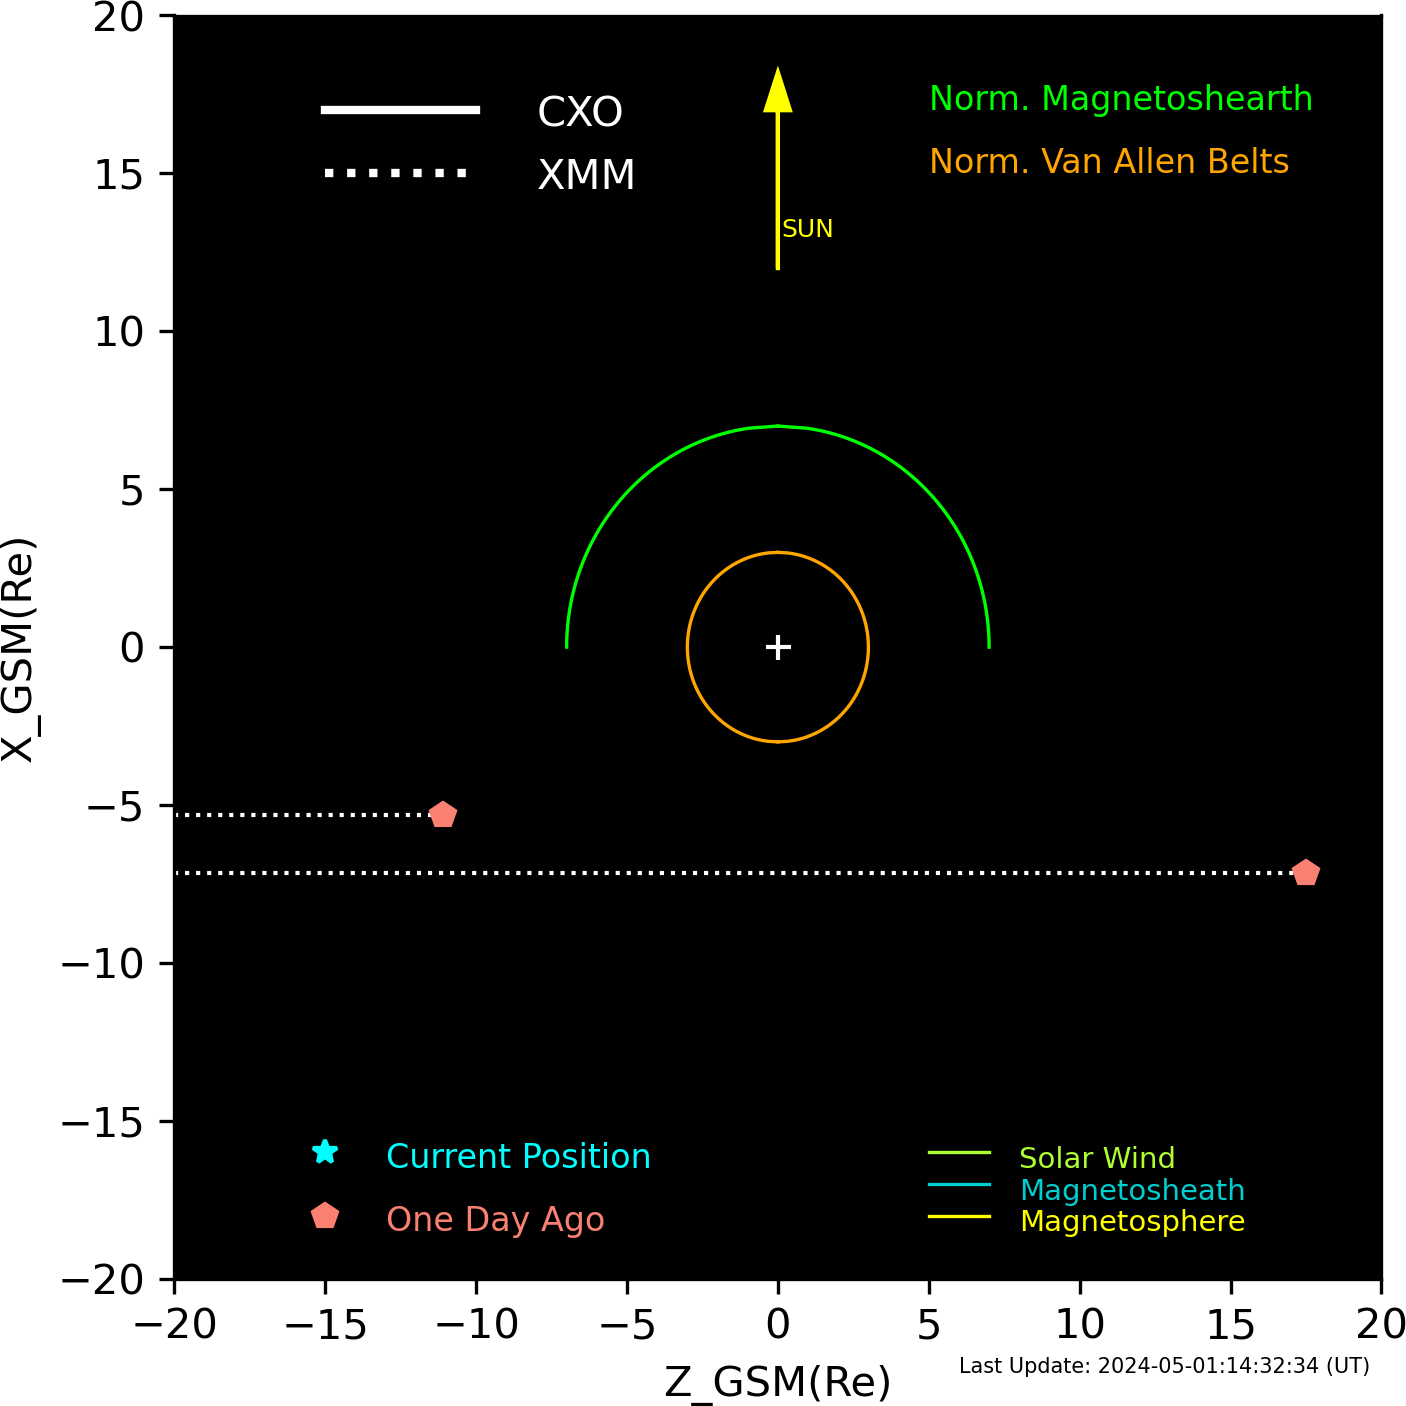
XMM and CXO orbits in GSM coordinates.
Email problems to: swolk
(Scott Wolk)
...it is all his fault