MTA group is monitoring AICS charge transfer inefficiency (CTI) continuously from the beginning of the mission. In this memo, we summarize what we see on MTA CTI page.
CTI of front side CCDs are very sensitive to a CCD focal plane temperature and a particle background. However, these effects are easily removed. (Grant et al (2005). See also Removing the CTI/Background Anti-Correlation by Grant, and Does The CTI Correction Factor Changes With Time? for related topics ). After removing these effects, the trend of the CTI degradation is a very smooth linear increase. The back side CCDs are, on the other hand, not sensitive to these two factors, and the changes of CTIs are also smaller compared to those of the front side CCDs. For the last 5 years, the rate of CTI change is very steady and gradual of ~ a few 10e-6 CTI/yr. Even the Oct 2003 CME did not affect the rate of the change (See Did ACIS CTI change after the Oct 2003 CME? by Grant).
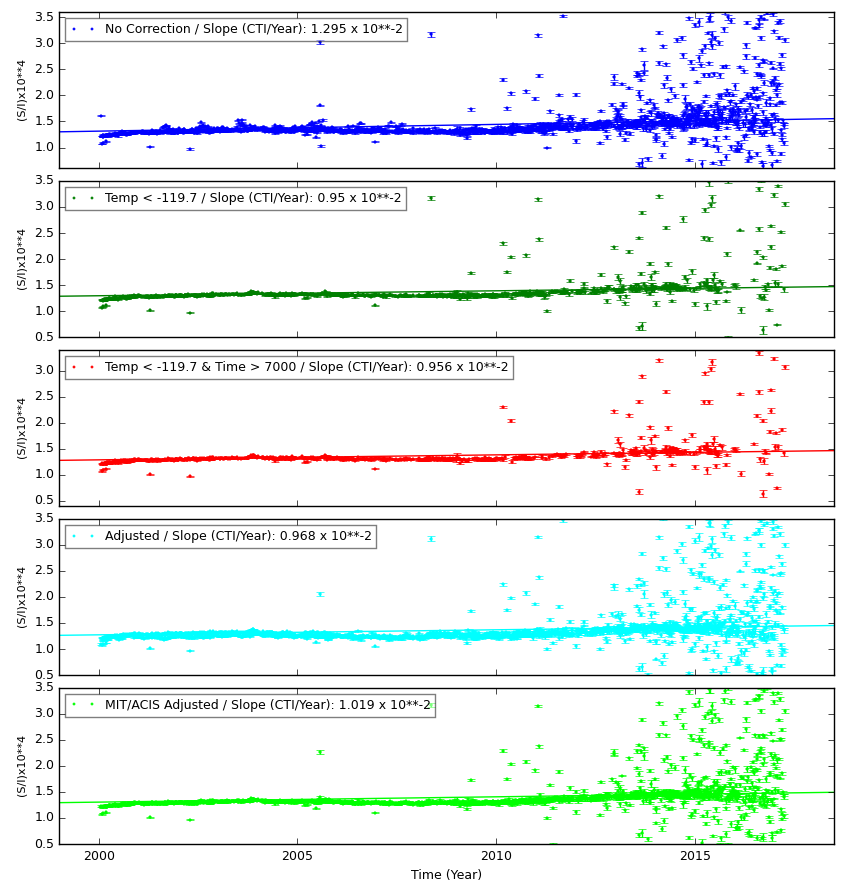
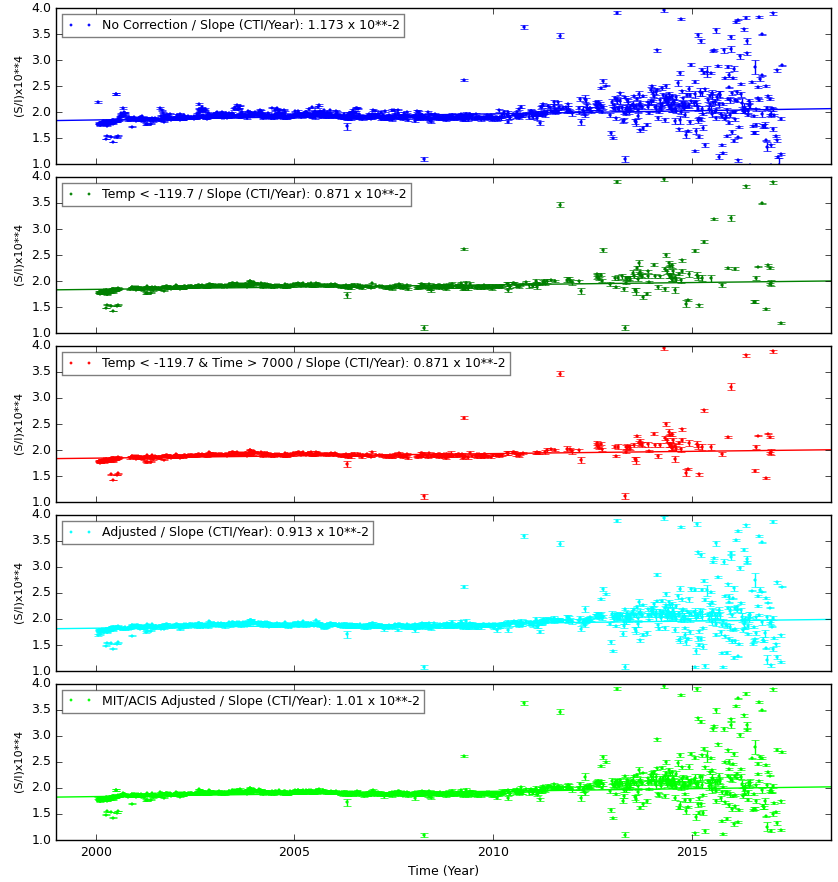
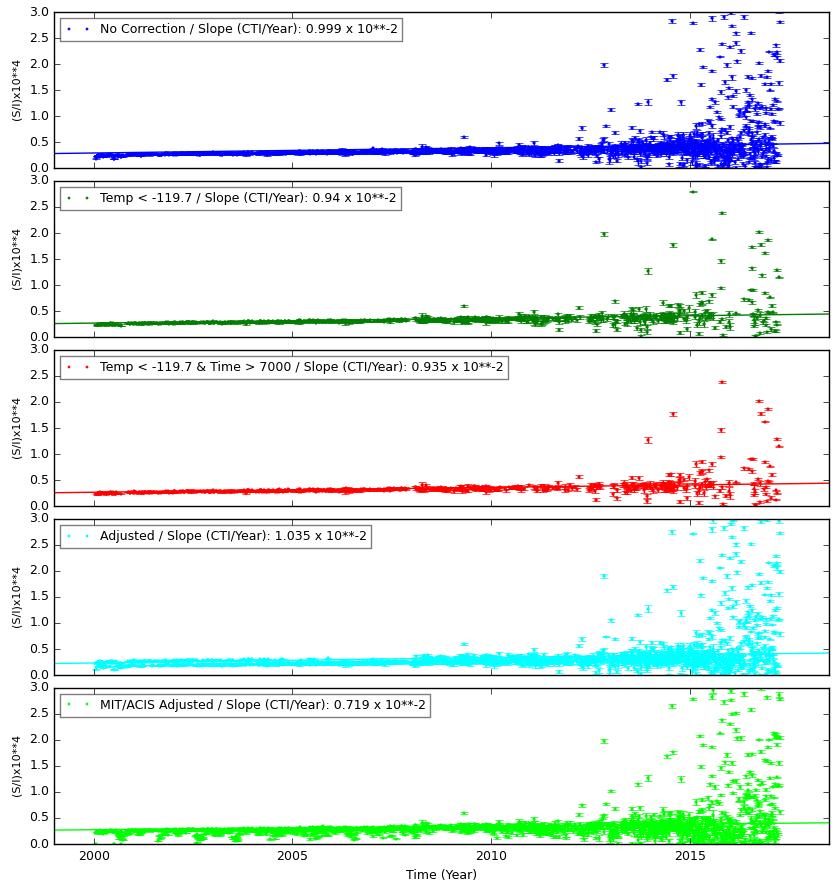
The following table and the plots show CTI trends after corrected temperature dependence of CTI, and particle background (Mn K-alpha). For comparison, CTIs with long exposure ( >7000 sec) and a focal plane temperature lower than or equal to -119.7 C are also plotted (both of them are particle background corrected, except for backside CTI). For I-array CTI computation, CCDs i-0, i-1, i-2, and i-3 are included. For S-array CTI, only s-0, s-2, s-3, and s-4 (front side CCDs) are included.
Since the temperature corrections uses the long exposure data
to estimate correction factors, the similarity of the slope values between these two
data sets is expected. Since the error of the slopes are about 0.07e-06 for all,
the slopes computed on these two data sets are basically identical.
|
Focal Temp<-119.7C Time >7000sec |
Focal Temp Corrected Time >2000sec |
|
|---|---|---|
| I-array CCD: | 0.956e-02 | 0.968e-02 |
| S-array CCD: | 0.871e-02 | 0.913e-02 |
| Backside (CCD5): | 0.935e-02 | 1.035e-02 |
Note: unit is CTI/yr, and errors are around 0.1e-02 for all the slopes.
The values are those of Apr 11, 2017.
The first table below shows CTI change per year for years 2000, 2005, 2010, and 2016, quad 0 of each CCD (based on Mn K-alpha: 10**-2 CTI/year). The second table shows averaged CTI of those years (S/I x 10**4). Except CCDs 5 and 7, all CTIs are corrected for the focal temperature and particle background.
| CCD | 0 | 1 | 2 | 3 | 4 | 5 | 6 | 7 | 8 | 9 |
|---|---|---|---|---|---|---|---|---|---|---|
| CTI Change Rate (Dec 2000) | 0.193 +/-0.075 |
0.262 +/-0.064 |
0.294 +/-0.064 |
0.289 +/-0.066 |
0.489 +/-0.089 |
-0.496 +/-0.431 |
0.267 +/-0.040 |
0.188 +/-0.038 |
0.367 +/-0.094 |
0.510 +/-0.077 |
| CTI Change Rate (Sep 2005) | 0.018 +/-0.067 |
-0.015 +/-0.065 |
0.212 +/-0.056 |
0.170 +/-0.053 |
0.018 +/-0.066 |
0.076 +/-0.063 |
0.134 +/-0.065 |
-0.097 +/-0.051 |
0.254 +/-0.056 |
0.058 +/-0.074 |
| CTI Change Rate (Mar 2010) | -0.341 +/-0.220 |
-0.166 +/-0.181 |
-0.116 +/-0.289 |
-0.233 +/-0.097 |
-0.015 +/-0.245 |
0.375 +/-0.219 |
0.192 +/-0.141 |
0.256 +/-0.188 |
-0.186 +/-0.142 |
-0.059 +/-0.250 |
| CTI Change Rate (Mar 2016) | 10.825 +/-6.443 |
6.475 +/-8.017 |
2.623 +/-4.603 |
4.248 +/-2.620 |
-6.367 +/-3.938 |
0.888 +/-1.992 |
2.664 +/-2.599 |
-0.179 +/-1.995 |
-0.389 +/-0.721 |
0.193 +/-1.362 |
| CCD | 0 | 1 | 2 | 3 | 4 | 5 | 6 | 7 | 8 | 9 |
| Avg. CTI (Dec 2000) | 1.135 | 1.230 | 1.448 | 1.426 | 2.006 | 0.211 | 1.715 | 0.125 | 1.417 | 1.623 |
| Avg. CTI (Dec 2005) | 1.187 | 1.341 | 1.543 | 1.510 | 2.151 | 0.230 | 1.864 | 0.120 | 1.551 | 1.772 |
| Avg. CTI (Sep 2010) | 1.275 | 1.410 | 1.728 | 1.659 | 2.292 | 0.283 | 1.904 | 0.181 | 1.636 | 1.874 |
| Avg. CTI (Mar 2016) | 2.551 | 2.591 | 2.584 | 2.339 | 2.655 | 0.883 | 2.391 | 0.984 | 1.804 | 2.520 |