Previous Next Contents
Instruments: LETG
The LETGS operated normally during 2002 with no significant instrument
anomalies or problems. Observations were undertaken for a range of
different types of X-ray sources: late-type stars, novae, AGN, X-ray
binaries, and one gamma-ray burst source. A spectacular Fast TOO was pulled off for the blazar Mkn 421 in 2000 October (P.I. F. Nicastro), catching the source in a very bright state. The resulting LETG+ACIS spectrum has about 4.2 million counts and clearly illuminates the different orders of the LETG perpendicular support structure diffraction (Figure 27).
Calibration activities have concentrated on attempting to understand and reduce the most important uncertainties in our current description of the instrument performance. Some of these activities are described below.
Higher Order Diffraction Efficiencies
One of the largest remaining sources of uncertainty in the effective area calibration of the LETGS lies in the efficiency of higher order throughput. The LETG diffraction efficiencies are based on optical constants for gold, in combination with an analytical diffraction model that assumes the individual gold grating bars have rhomboidal cross-sections. The parameters describing the rhomboids influence the predicted diffraction efficiency in the higher orders much more than they do for first or 0th order diffraction.
In the current diffraction model, each of the 540 circular grating
elements making up the LETG assembly have their own set of rhomboidal
parameters. In this way, the diffraction efficiency for the ensemble
is an average of the efficiencies of all the different grating
elements (weighted as a function of energy by their respective mirror
shell effective areas). The initial set of rhomboidal parameters used
prior to launch in the diffraction model of each grating element,
together with the mean period and period variance, were determined
using laboratory infrared measurements. The resulting grating model
met its first major X-ray challenge during end-to-end calibration
activities at the MSFC X-ray Calibration Facility. Analysis of tests
designed to probe the efficiency of diffraction in the various orders
indicated generally good agreement between observation and model for
first order - to 10-15% or so-though with some much larger discrepancies in the wavelength range ~ 6-12 Å (1-2 keV), shortward of the gold M edges, where the diffraction efficiencies are changing fairly rapidly.
Prompted by the observed discrepancies, post-XRCF activities of the
MPE and SRON groups included tests of diffraction efficiencies of
spare grating elements at the German PANTER facility. The MPE team
lead by Peter Predehl analyzed these data and concluded that, while a
single set of rhomboidal parameters for a given grating element could
match the observed diffraction efficiency in any one order reasonably
well, no set of parameters could be found that simultaneously matched
observed efficiencies in all the orders. The current LETG diffraction
model uses different parameters for different spectral orders - a fudge.
Why is the model failing? Electron microscope pictures of grating bars for this and similar gratings suggest to the eye that for any given bar the rhomboid is not a bad approximation. However, the approximation of the same rhomboidal shape is likely not so good for all the bars of a single LETG facet, and dependency of diffraction efficiency on rhomboidal parameters for different spectral orders is non-linear. While it would be technically feasible (though non-trivial) to construct a new analytical model that allows for a more general description of grating bars, it is not immediately obvious that such an effort would be worthwhile: data likely do not exist to constrain uniquely any additional parameters.
The LETG group at CXC has recently completed an extenOptionssive and detailed re-analysis of XRCF diffraction efficiency tests and we find the current grating model in agreement with the data to a level of typically 10% or better for first order. In higher orders, we have indications of larger discrepancies. These discrepancies are backed up by analyses of in-flight observations of bright, narrow spectral lines seen in multiple orders, supporting the general conclusion that we need to modify the efficiencies for 2nd and 3rd orders by as much as 30% or so at wavelengths above ~12 Å (1 keV) or so. At shorter wavelengths, 2nd and 3rd orders tend to agree better with the model. A comprehensive analysis of on-orbit LETG+ACIS-S spectra, including that from the recent Mrk421 observation, is in progress. Improved higher order efficiencies are expected to be available later this summer.
Further details on higher order diffraction efficiencies can be found at the web page listed at the end of this article.
Gain Sag?
Measurements of the flux from HZ 43 in the longest wavelengths of the LETG+HRC-S (~ 150Å 0.08 keV) have revealed a trend of very slowly decreasing count rate over the time since the first post-launch observation. The total change since launch so far is at a level of about 4% or less. Since this is much smaller than the estimated absolute calibration accuracy of 15-20% at these wavelengths, this is not a significant source of additional error. While analysis is still ongoing, it appears that the gradual decrease in count rate is due to gain sag in the HRC-S detector. Some small fraction of the lowest energy photon events are then lost because their pulse heights fall below a threshold limit used to reject "bad" events. Such a drop in gain is common in microchannel plate detectors after some time in the radiation and operating environment of orbital satellites. The detector voltages that control gain can be adjusted to compensate for this and we will be monitoring the general trends of gain and effective low energy quantum efficiency to determine if and when such a voltage change might be worthwhile.
Numerics and the Dispersion Relation
Shortly after launch, analysis of LETG+HRC-S spectra of Capella and other coronally-active late-type stars revealed a puzzle in the dispersion relation. It appeared as though the outer plates of the HRC-S detector had a different dispersion relation than that of the central plate, in the sense that the outer plates needed a larger Rowland diameter. This obviously could not be caused by the grating, and so all aspects concerning the detector that might enter into the effective dispersion relation were carefully examined; no plausible source for the effect was found. As simulation tools improved and we were able to process accurate grating ray trace experiments through the Chandra pipe, it became apparent that the dispersion problem could also be found in simulations. As we improved the simulations and tried different detector and grating combinations, the same effect was seen in HETG tests. This pointed the finger unambiguously in the direction of software. It was John Davis from the CXC group at MIT who discovered that a string of numerical operations in the computation of diffraction angle accumulated an increasingly large systematic error going toward longer wavelengths. A fix for this bug has been tested and will be implemented in the next software release.
Detectors and the Dispersion Relation
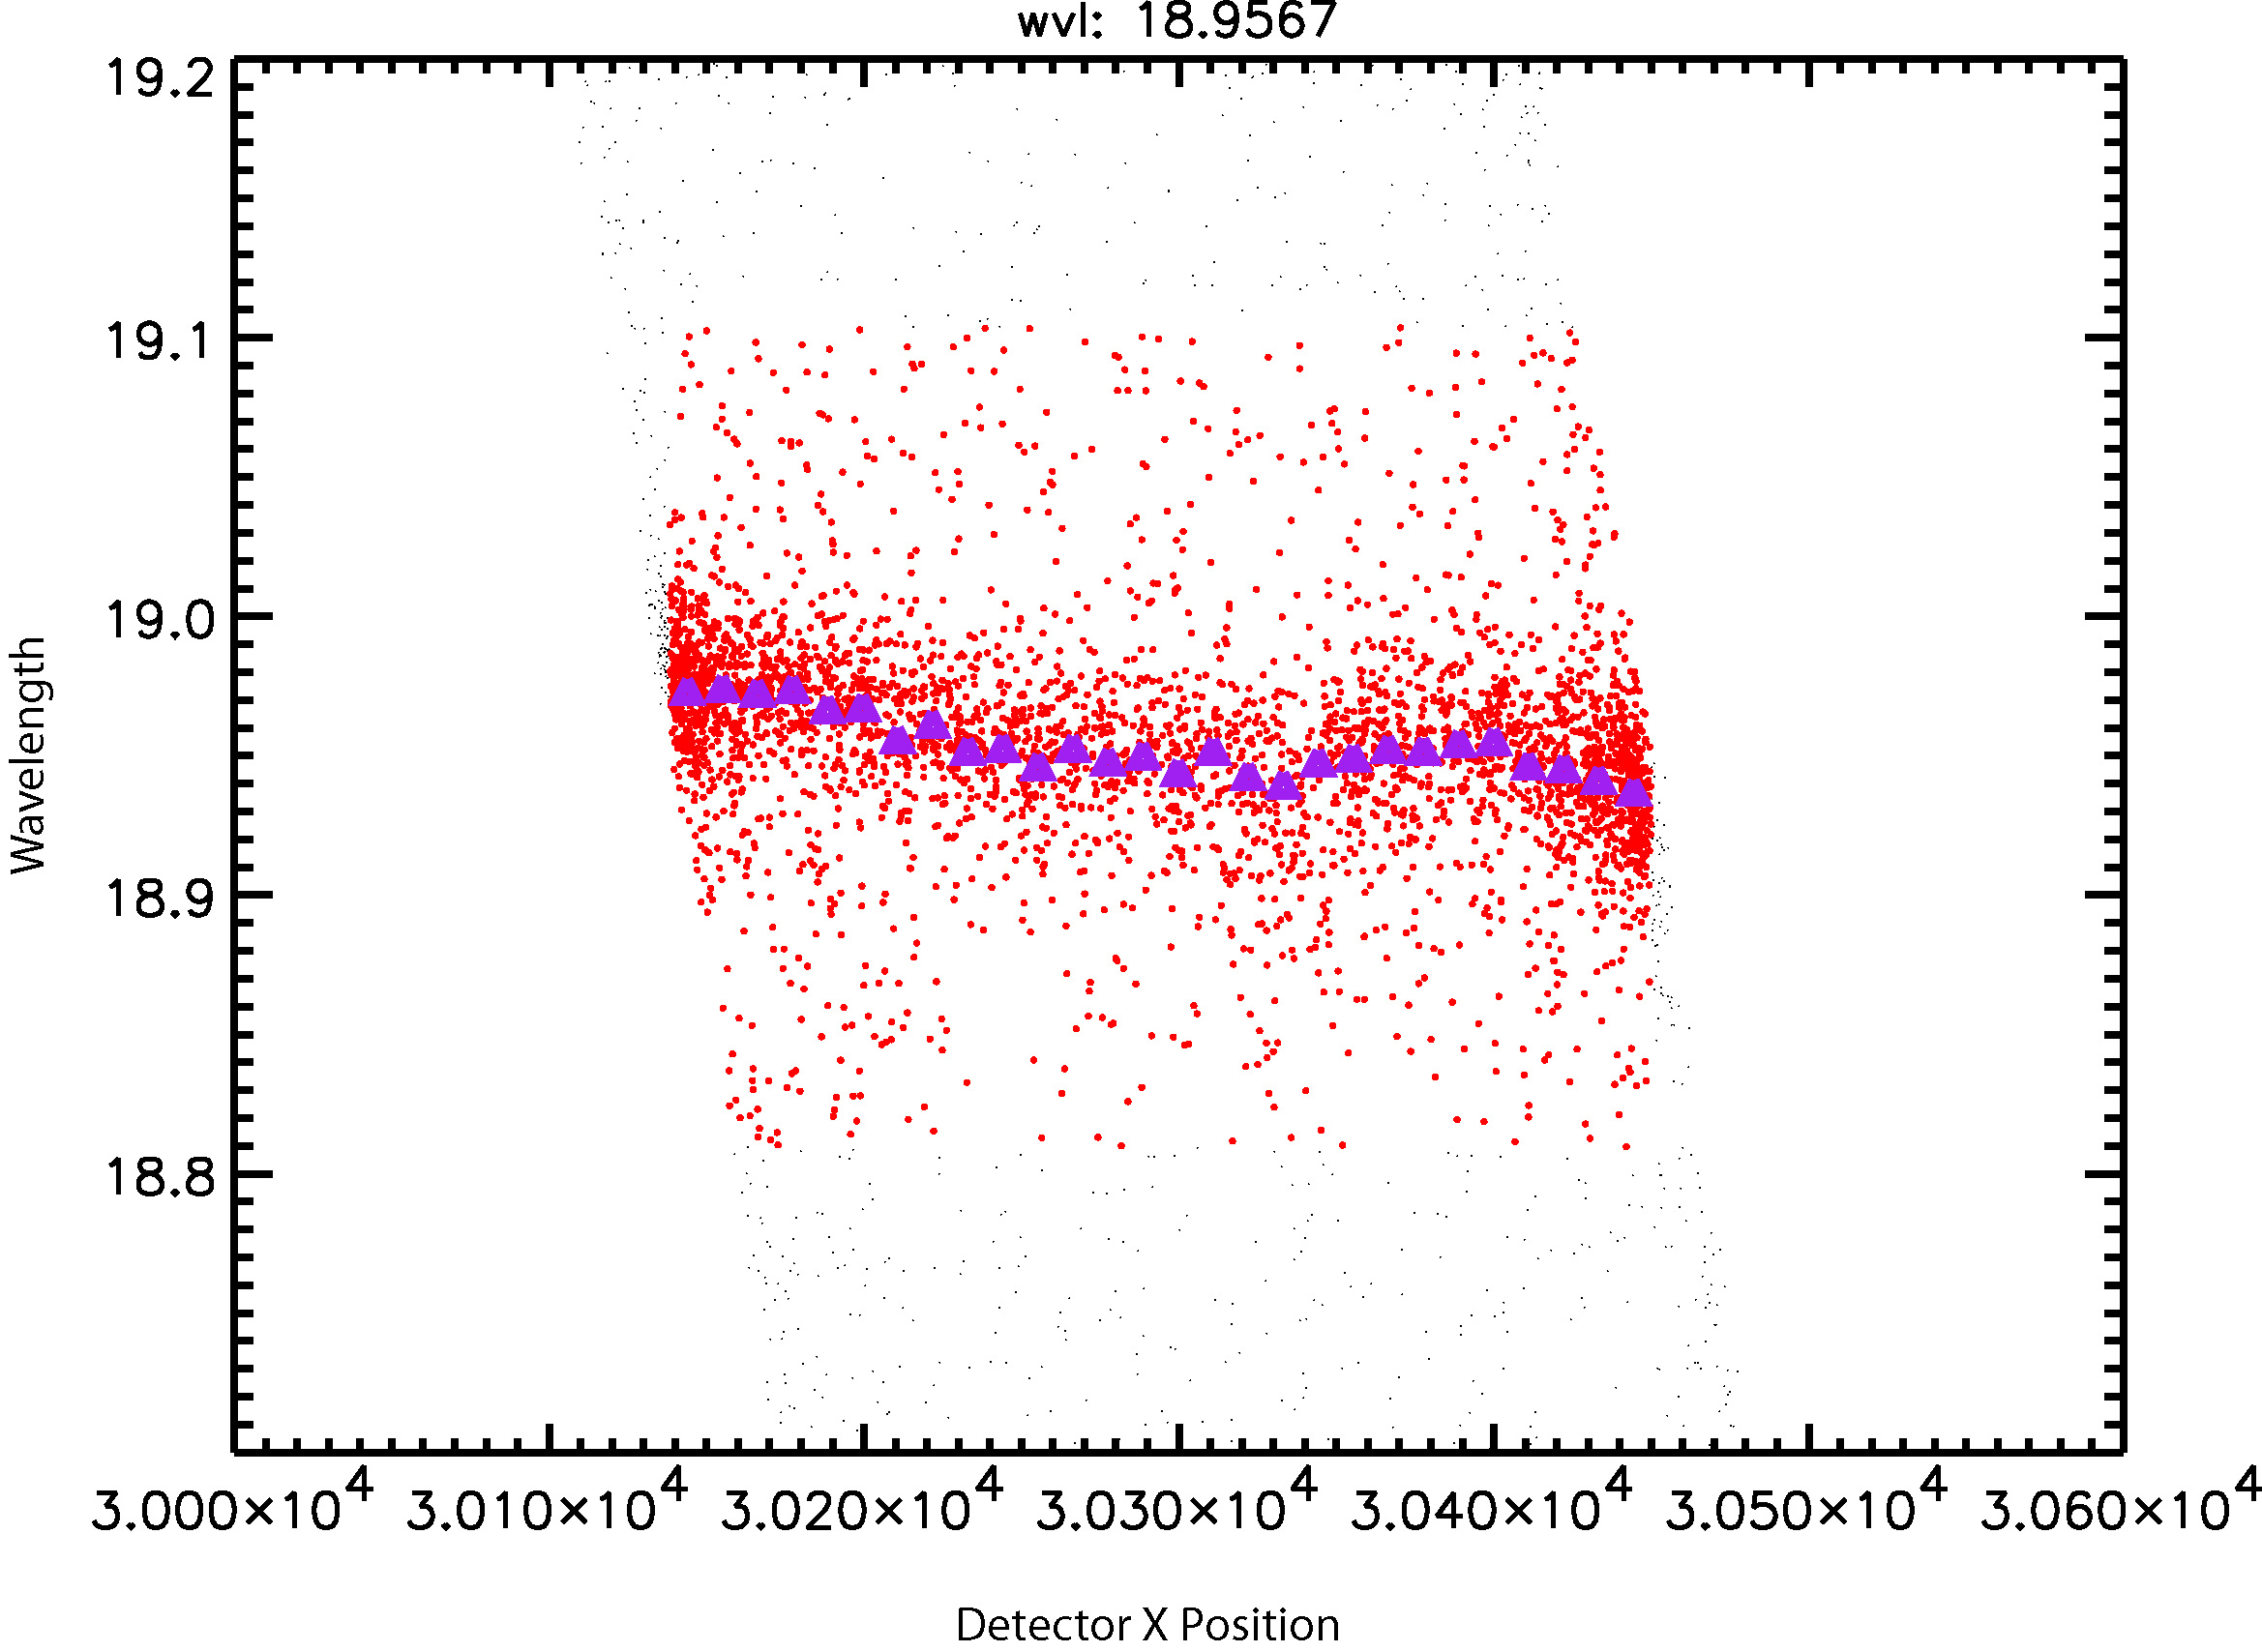
FIGURE 16: The observed wavelengths of photon events in the vicinity
of the O VIII Lyα doublet seen in the LETG+HRC-S spectrum of Capella
plotted as a function of detector x (pixels) position. The spread of
events in the horizontal direction is due to the spacecraft dither and
corresponds to 40 arcsec on the sky, and approximately 2mm in
detector space. The triangles mark the measured centroids of the line
events when divided into bins in the x direction. The bg
non-linearities in the detector that can amount to several hundredths
of an Å ngstrom.
While absolved from causing systematic errors in the dispersion
relation, the HRC-S detector was strongly suspected as the cause of
small-scale non-linearities. While no hints of non-linearities were
found in XRCF or pre-flight laboratory tests, such effects were seen
soon after launch in the spectra of coronal sources with narrow
spectral lines. Study during the ensuing year or two concentrated on
attempting to quantify the effects--very difficult for the majority of--
--the LETG+HRC-S range because of a--
--lack of very bright sources at--
--longer wavelengths with bright--
--spectral lines--which turned out to
be more widespread on the detector
than previously thought. See Figures
9 and 10 in the HRC section for
examples of our analysis. An example
is illustrated in Figure 16, where the
computed wavelengths for photon events
for the bright O VIII Ly α
doublet in the spectrum of Capella are
shown as a function of detector x
(dispersion axis) position. The
spread in detector x is caused by the
component of spacecraft dither along
the axis of dispersion. If the
detector were behaving perfectly
linearly, all the events should fall
along a straight line. Instead,
significant "wobble" is seen. Methods for correcting for this effect are being investigated and mapping of the distortions is ongoing. Observers need to be aware that such effects can shift the apparent wavelengths of spectral lines by a few hundredths of an Angstrom from their true positions, and that spectral line widths can be larger than predicted by raytrace and other "ideal" models of the instrument response.
HRC-S or ACIS-S for Cycle 5?
The accumulation of a contaminating layer on the ACIS instrument that
reduces its effective quantum efficiency at longer wavelengths (>
12 Å) is an important issue to consider when choosing a detector
for cycle 5 LETG proposals. Proposers are encouraged to consult the
POG to see comparisons of effective areas for both LETG+HRC-S and
LETG+ACIS-S combinations. The HRC-S currently offers a significantly
larger effective area for wavelengths > 20Å (< 0.6 keV) or so.
Observer and proposer information and news on the performance of the Chandra LETGS can be found on the instruments and calibration page:
http://cxc.harvard.edu/cal/Links/Letg/User/
Calibration Workshop Presentations are at:
http://cxc.harvard.edu/ccw/proceedings/02_proc/index.html#grating
Including a discussion of higher order diffraction efficiencies at:
http://cxc.harvard.edu/ccw/proceedings/presentations/bradw/letg/index.html
Jeremy Drake, for the LETG Team
Previous Next Contents