The Results of the Cycle 7 Peer Review
Previous Contents Next
The Results of the Cycle 7 Peer Review
The Cycle 7 observing and
research program was selected following the recommendations
of the peer review panels. The peer review was held 21- 23
June 2005 at the Hilton Boston Logan Airport. 103 reviewers
from all over the world attended the review, sitting on 13
panels to discuss 747 submitted proposals. The panels were
organised as follows:
Galactic
Panels 1,2: Normal Stars, WD, Planetary
Systems and Misc
Panels 3,4: SN, SNR + Isolated
NS
Panels
5,6,7: WD Binaries +
CVs, BH and NS Binaries,
Galaxies:
Populations
Extragalactic
Panels 8,9: Galaxies: Diffuse Emission,
Clusters of Galaxies
Panels 10,11,12: AGN, Extragalactic
Surveys
Big Project
Panel: LP and VLP proposals
The over-subscription rate in
terms of observing time for Cycle 7 was 6:1, very similar to
previous cycles.
As is our standard procedure, all proposals were reviewed
and graded by the
topical panels, based primarily upon their scientific
merit, across all proposal
types. The topical panels produced a rank-ordered list along
with detailed recommendations for individual proposals where
relevant. The topical panels were allotted Chandra time to cover the allocation of
time for GO observing proposals based upon the demand for
time in that panel. They were also allocated money,
similarly based upon demand, to fund archive and theory
proposals. New this cycle, they were allotted a maximum
number of constrained observations, based upon the number of
constrained observations requested in that panel and chosen
to ensure that only 15% of approved observations were time
constrained. Large and Very Large Projects were discussed by
the topical panels and ranked along with the rest, and the
recommendations of these panels were recorded and passed to
the Big Project Panel.
Following the deliberations of
these topical panels, the Big Project Panel discussed and
recommended Large and Very Large Projects to be included in
the Cycle 7 science program.
The resulting observing
and research program for Cycle 7 was posted on the CXC
website two weeks later, 8 July 2005. Letters detailing the
results and providing a report from the peer review were
mailed to each PI in early August. Observations of Cycle 7
targets began in the fall 2005, with an overlap of about 6
months expected before Cycle 6 observations are
completed. This is an unusually long overlap due to the
difficulty of scheduling observations with the restrictions
on pitch angle in place in 2005.
Each year we publish numerical
statistics on the results of the peer review These can be found from
the “Statistics” link for a given cycle, which is linked
from the “Target Lists and Schedules” area of our
website. This year, for the first time, we are presenting a
subset of those statistics here, in a more easily viewable
form, based on presentations made to the Chandra Users’ Committee. We expect this
to become a regular feature in future
Newsletters.
Figure 39 shows the number of proposals submitted of each
proposal type (e.g. GO,
LP, Archive etc.) as a function of cycle. Since more
proposal types have become available in each cycle, the
number classified as GO has decreased as other types
increase.
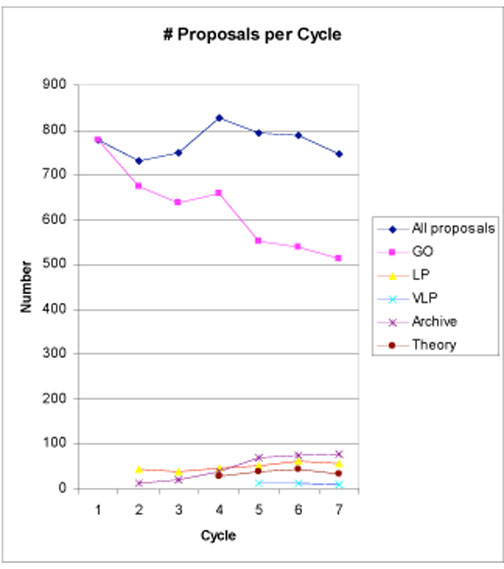 FIGURE 39: Proposals by type for each
observing cycle.
FIGURE 39: Proposals by type for each
observing cycle.
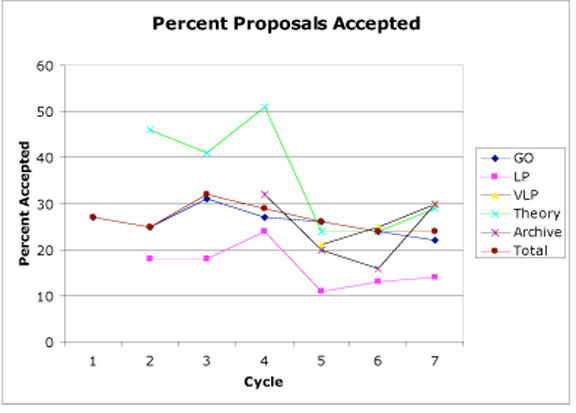
FIGURE 40: Percent proposals accepted by
type, as a function of cycle.
The total number of submitted
proposals is remarkably constant.
Figure 40 shows the percentage
of proposals accepted, all or in part, for each type as a
function of cycle. Please note that some of the fluctuations
are due to small number statistics (e.g. Theory
proposals).
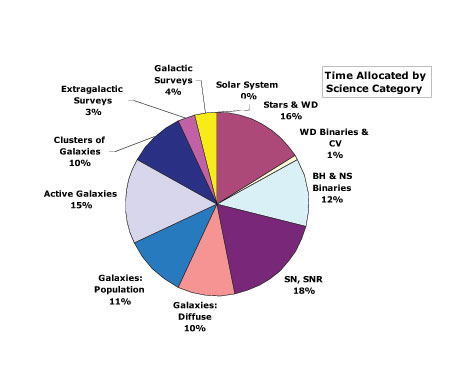
Figure 41 is a pie chart indicating the
percentage of Chandra
time allocated in each
science category. But note that the time available for each
category is determined by the demand.
|
Country
|
Submitted
|
Approved
|
|
Australia
|
2
|
|
|
Austria
|
4
|
|
|
Belgium
|
4
|
1
|
|
Brazil
|
2
|
|
|
Canada
|
6
|
2
|
|
Finland
|
1
|
|
|
France
|
8
|
3
|
|
Germany
|
22
|
8
|
|
Greece
|
1
|
|
|
Israel
|
1
|
|
|
Italy
|
28
|
7
|
|
Japan
|
18
|
2
|
|
Netherlands
|
21
|
8
|
|
Scotland
|
1
|
|
|
Spain
|
5
|
2
|
|
Switzerland
|
6
|
3
|
|
United Kingdom
|
48
|
5
|
|
United States
|
569
|
142
|
|
Total Foreign
|
178
|
41
|
Table 5 - Proposals by
country.
FIGURE 41: Time allocated by science
category.
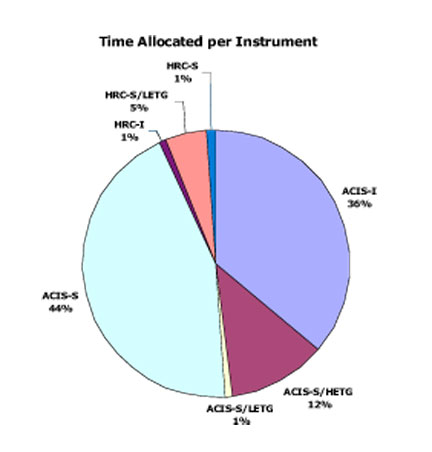
FIGURE 42: Time allocated by
instrument.
Figure 42, a second pie chart, shows the percentage of Chandra time allocated to observations for each instrument configuration.
Belinda Wilkes