The goal of  is to provide a uniform (not necessarily optimal)
database for the comparison of data from different clusters.
is to provide a uniform (not necessarily optimal)
database for the comparison of data from different clusters.
This section is our cookbook for running the ANCHORS pipeline and
a location for notes during this development phase. It contains some
information only of internal interest (like specific script names), but
also has notes on default parameter settings of interest to general users.
Processing
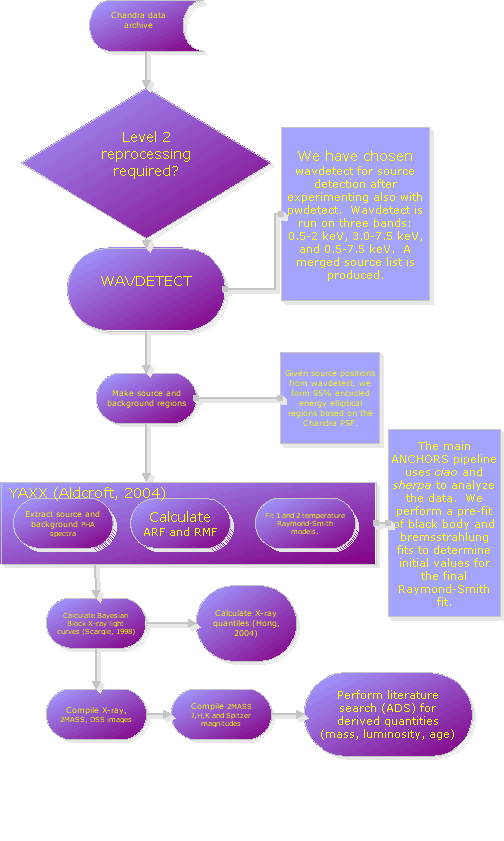
To accomplish automated analysis we employ several independent software packages. This allows for much code-reuse and minimal buy-in costs or new development.
Data Preparation
Standard CXC data products and CIAO software tools are used to download data from the archive, to create exposure maps (merge_all), and to detect point sources (Wavdetect). Source detection is done in a 3 step recursive blocking fashion. Appropriate source and background regions are constructed based on the Chandra PSF library and desired encircled energy using the parameterization by C. Allen (2003).
Standard Analysis
The Yaxx package by Tom Aldcroft (CfA) completes the analysis steps..
- Extract source events.
- Extract source and background spectra.
- Fit spectra using Sherpa. This step can be repeated any number of times for different models and different initial guesses.
We have found the Raymond-Smith (R-S) model to be the most reliable in
fitting coronal sources (Wolk, 2005). For all sources with more than 20
counts, a single temperature R-S model with absorption is used
(xswabs*xsraymond). In addition, for sources with at least 100 counts,
a two temperature R-S fit is made (xswabs*[xsraymond+xsraymond]).
Finally, for the brightest sources with more than 200 counts we add
metalicity as a free parameter in the two temperature fit (it is frozen
at 0.3 in the first 2 fits). In all cases, we attempt to estimate the best
initial parameter values by performing the fit in stages. First, we apply
a simple blackbody (xsbbody) model with an initial kT=1 keV and nH=0.1 cm^-2.
The temperature result of this fit is used next as the initial
guess in a thermal bremsstrahlung (xsbremss) fit. Last, this result is
assigned to the R-S model (temperature 1 in the case of a two temperature
fit) and the final fitting is performed.
September 2007 - We are adding APEC and Mekal model fits in the same way.
Add-on Analysis
Quantile Spectral Analysis (JaeSub Hong, CfA, 2004) augments spectral fitting and traditional hardness ratios. Quantile analysis determines the energy values that divide the detected photons into fractions of the total counts. This is especially useful for faint sources where low statistics preclude meaningful spectral fitting.
Bayesian Block lightcurves (Jeffrey Scargle, MIT, 1998) yield a segmentation of time intervals during which the photon arrival rate is statistically constant. The resulting locations, amplitudes, and rise and decay times provide another metric for identifying flaring and variable candidates. The code is written in s-lang.
Gregory-Laredo lightcurve statistics
Hardness ratios
Data Compilation/Output
The Yaxx output data files in FITS and ASCII are compiled and converted to XML by Perl scripts. Available information from other sources is included when possible. Some of this is generated automatically. For example, DSS and 2MASS images are downloaded using SkyView and a link to query SIMBAD for basic data and name cross-references can be easily created given any source position. Other facts must be gathered manually. Here, a query of the Astronomical Data System (ADS) and scan of the returned articles can turn up mass, distance, and multi-band magnitude values.
The YAXX output files are processed by PERL scripts to create the ANCHORS
web pages.
Output
Under development
- General pipeline
- insert dependancy checks to run only neccesary steps when reprocessing
- combine multiple observations (merged with reproject_events for source
detection and quantiles, separated for spectral fitting and lightcurves)
- define gratings zero order processing
- continue maintainance and traceability of all codes using CVS
- Source detection
- automate 3 band recursive blocking source list merging - done
- multiple energy band runs
- continue to tweak automatically selected background regions
- employ smaller encircled energy ellipses in crowded neighborhoods
- YAXX
- add simultaneous fitting of multiple obsids
- use cash statistics with powell optimization for low count sources (< 30 cnts)
- Post-yaxx steps
- add verification and validation with 1) report to operator and
2) requeuing failed sources to process again with adjusted parameters
i. bad spectral fits detected by too high or too low chi^2
ii. pileup noted by count rate > TBD
iii. bad source or background regions such as overlapping sources
or contaminated regions indicated by similar spectra and counts
between adjacent sources and large difference between raw and
net counts
- calculate Bayesian blocks at multiple significance levels
- ingest to SQL
- Web pages
- produce and properly scale full field Chandra, 2MASS, and DSS images
- click to enlarge all images
- K-S test results
- Vizier
- Webda
- heasarc 3browse
- IRAC/Spitzer (SIRTF)
- sorting/searching
Modifications made to ACIS_Extract (no longer used, July 2004)
- Don't know 'FILE_MOVE' procedure called at ~line 4222
changed to spawn,'mv ...
- Modified wabs_raymond.xcm to do wabs_raymond_2temp.xcm
- Change default spectral bin sizes
acis_extract.pro ~line 4105
> 500 source counts --> 60 cnts/bin
< 500 source counts --> 40 cnts/bin
< 200 source counts --> 25 cnts/bin
< 100 source counts --> 15 cnts/bin
< 50 source counts --> 7 cnts/bin
< 20 source counts --> 5 cnts/bin
Science background
Resource links
Versioning scheme
Go to ANCHORS Home