FP_TEMP temperatures check
Summary
| Date start | 2019:091:13:53:30.882 |
| Date stop | 2019:098:11:04:35.415 |
| FP_TEMP status | NOT OK |
| Load directory | /data/acis/LoadReviews/2019/APR0119/ofls |
| Run time | Thu Mar 28 13:54:16 2019 by acisdude |
| Run log | run.dat |
| Temperatures | temperatures.dat |
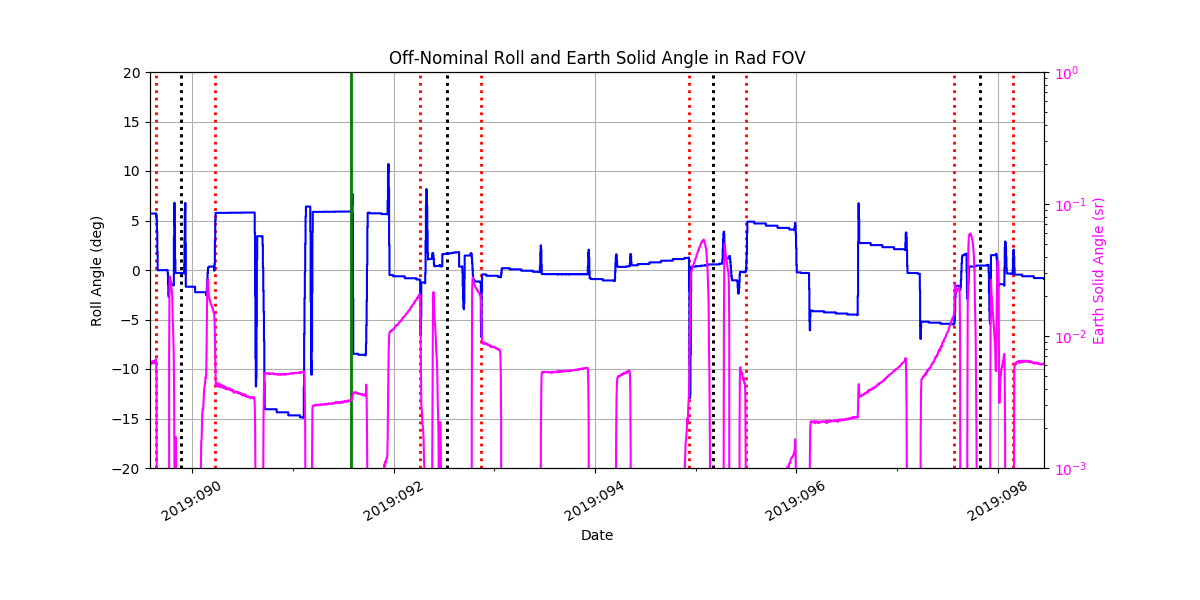
| Earth Solid Angles | earth_solid_angles.dat |
| States | states.dat |
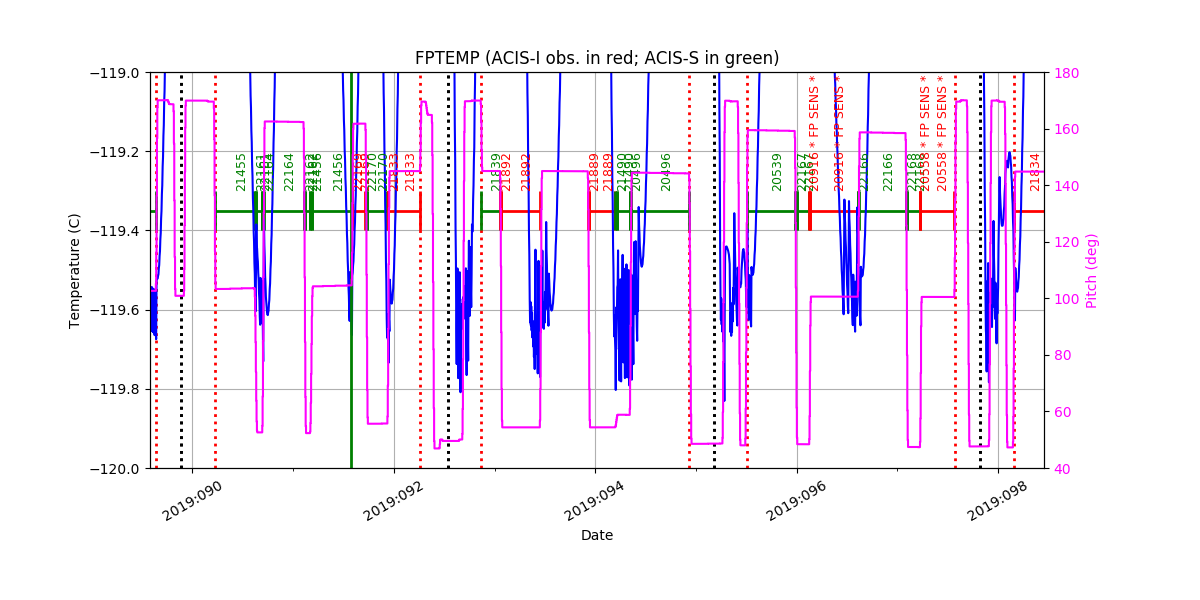
ACIS-I FP_TEMP -114 deg C Violations
| Date start | Date stop | Max temperature | Obsids |
|---|---|---|---|
| 2019:092:06:13:26.816 | 2019:092:06:13:26.816 | -114.00 | 21833 |
No ACIS-S -112 deg C FP_TEMP Violations
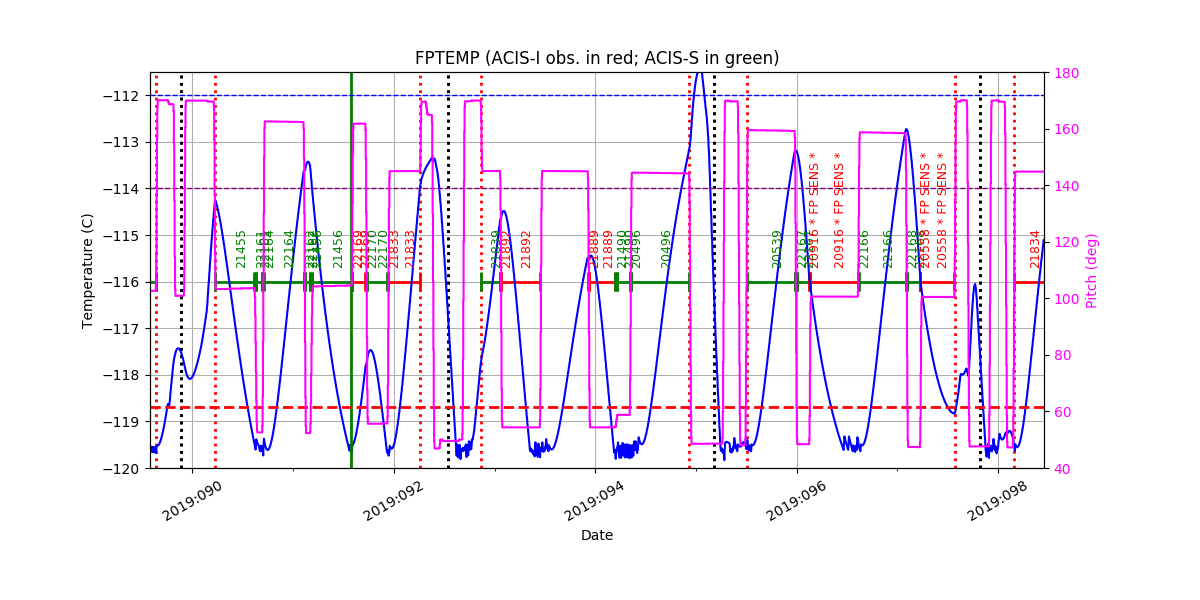
FP TEMP Sensitive, -118.7 deg. C Preference Not Met:
| Date start | Date stop | Max temperature | OBSID |
|---|---|---|---|
| 2019:096:03:03:58.816 | 2019:096:08:10:06.816 | -115.99 | 20916 |
| 2019:097:05:29:18.816 | 2019:097:11:57:26.816 | -115.99 | 20558 |
No ECS Observation -118.7 deg C FP_TEMP Violations
FP_TEMP Model Validation
MSID quantiles
| MSID | 1% | 5% | 16% | 50% | 84% | 95% | 99% |
|---|---|---|---|---|---|---|---|
| FPTEMP | -1.13 | -0.77 | -0.48 | -0.06 | 0.53 | 0.98 | 1.95 |
| PITCH | -3.633 | -0.234 | -0.164 | -0.017 | 0.093 | 0.196 | 3.821 |
| TSCPOS | -1 | -1 | -1 | 0 | 0 | 1 | 1 |
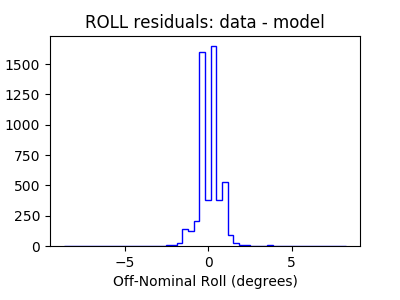
| ROLL | -1.619 | -1.043 | -0.415 | 0.206 | 0.676 | 1.037 | 1.587 |
Validation Violations
| MSID | Quantile | Value | Limit |
|---|---|---|---|
| PITCH | 1 | -3.633 | 3.00 |
| PITCH | 99 | 3.821 | 3.00 |
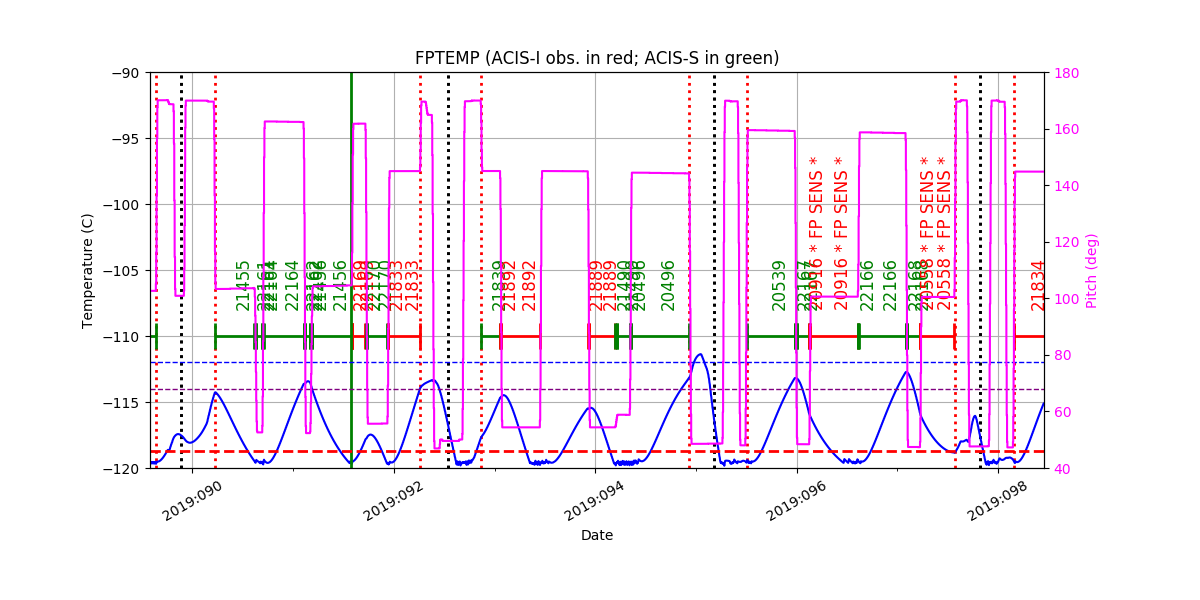
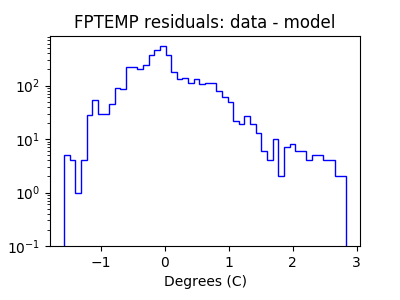
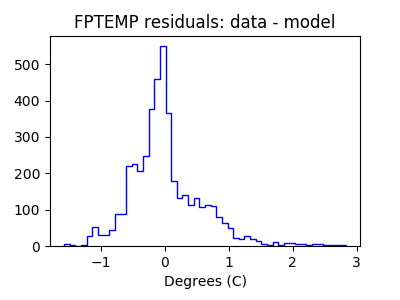
FPTEMP
Red = telemetry, blue = model
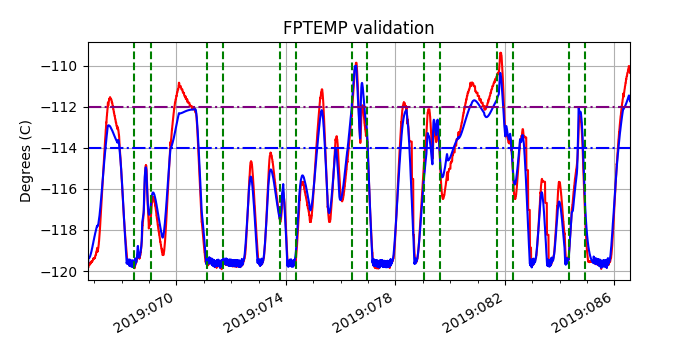
Data for FPTEMP residual plots limited between -120.0 and -112.0 deg. C
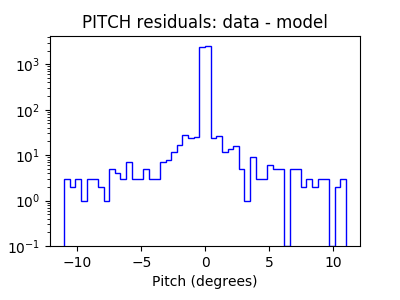
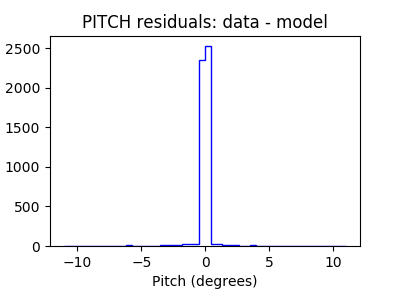
PITCH
Red = telemetry, blue = model
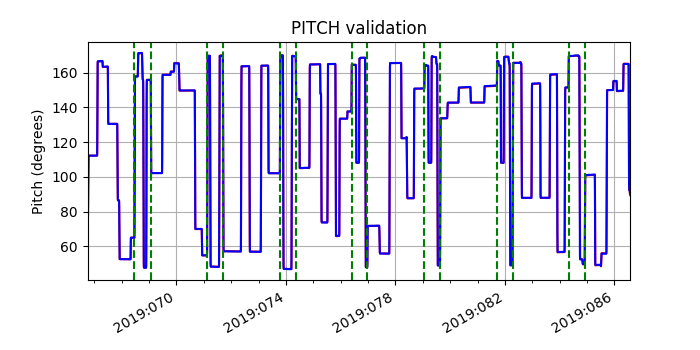
Data for FPTEMP residual plots limited between -120.0 and -112.0 deg. C
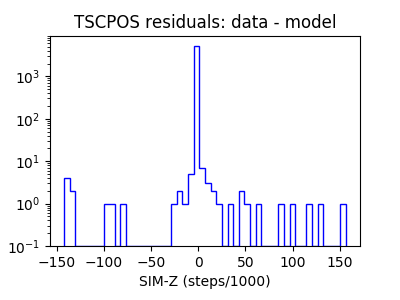
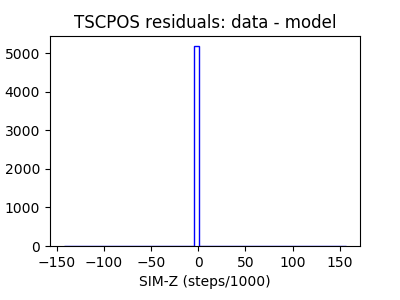
TSCPOS
Red = telemetry, blue = model
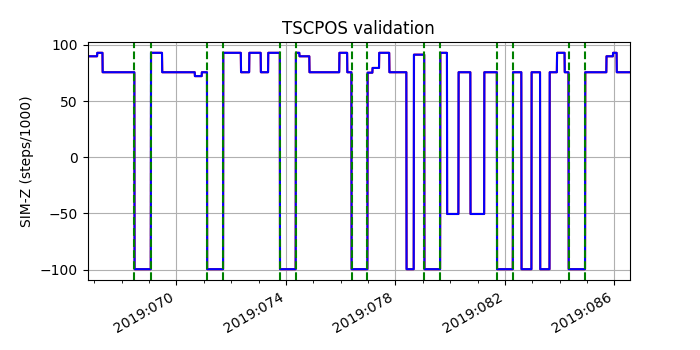
Data for FPTEMP residual plots limited between -120.0 and -112.0 deg. C
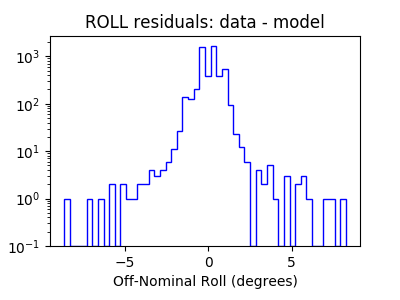
ROLL
Red = telemetry, blue = model
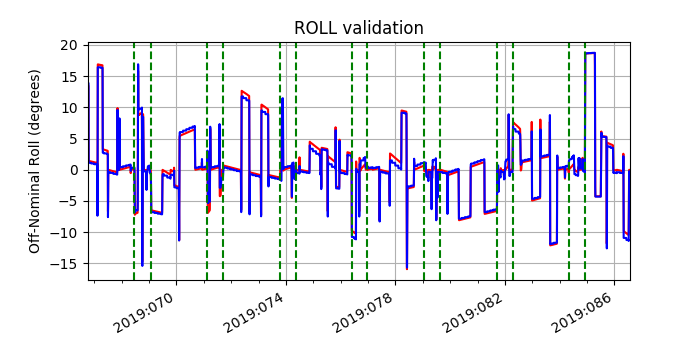
Data for FPTEMP residual plots limited between -120.0 and -112.0 deg. C
ADDITIONAL PLOTS
Additional plots of FPTEMP vs TIME for different temerature ranges