2019 TMP_FEP0_FB Low Violations
TMP_FEP0_FB Planning Low Limit Violations
Date start |
Date stop |
Min temperature |
Duration (ks) |
Plot |
|---|---|---|---|---|
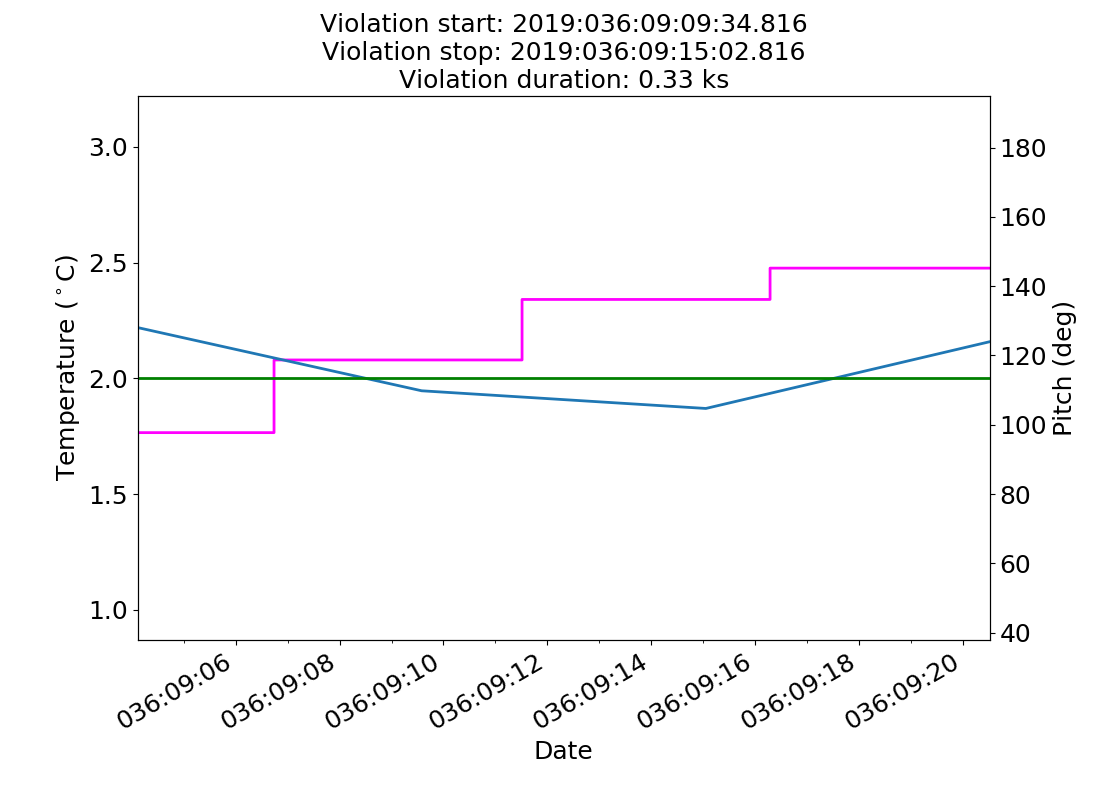
2019:036:09:09:34.816 |
2019:036:09:15:02.816 |
1.87 |
0.33 |
|
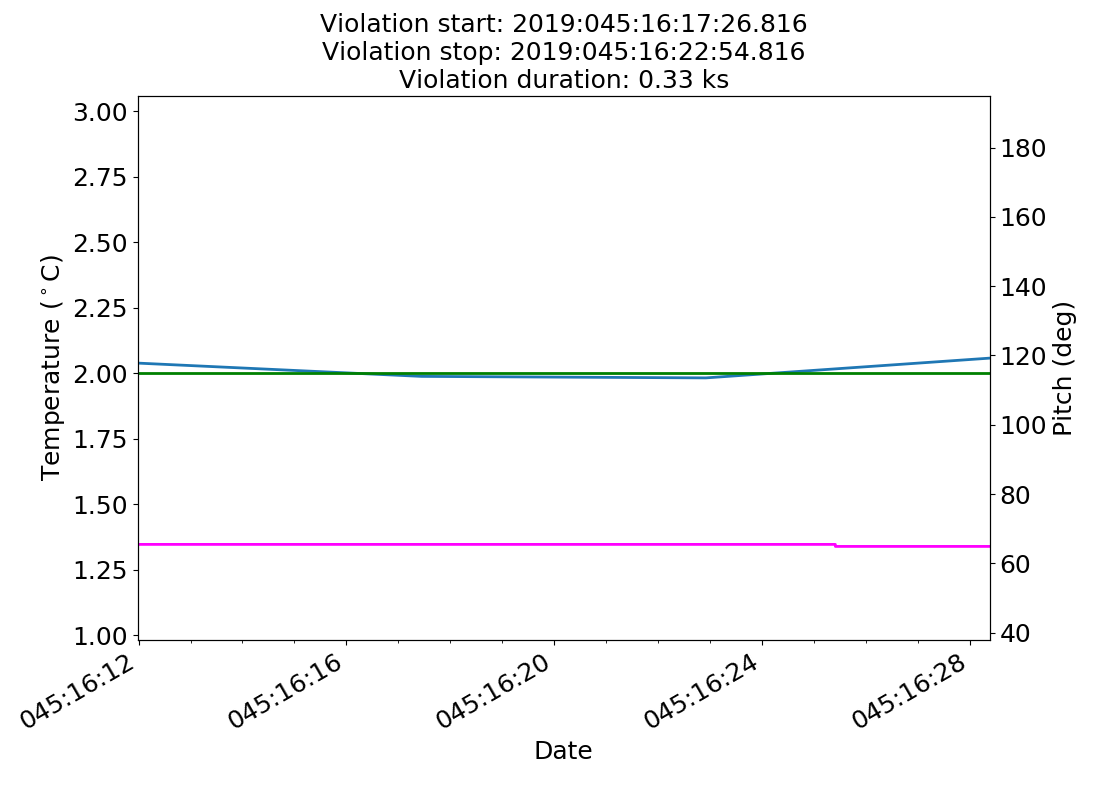
2019:045:16:17:26.816 |
2019:045:16:22:54.816 |
1.98 |
0.33 |
|
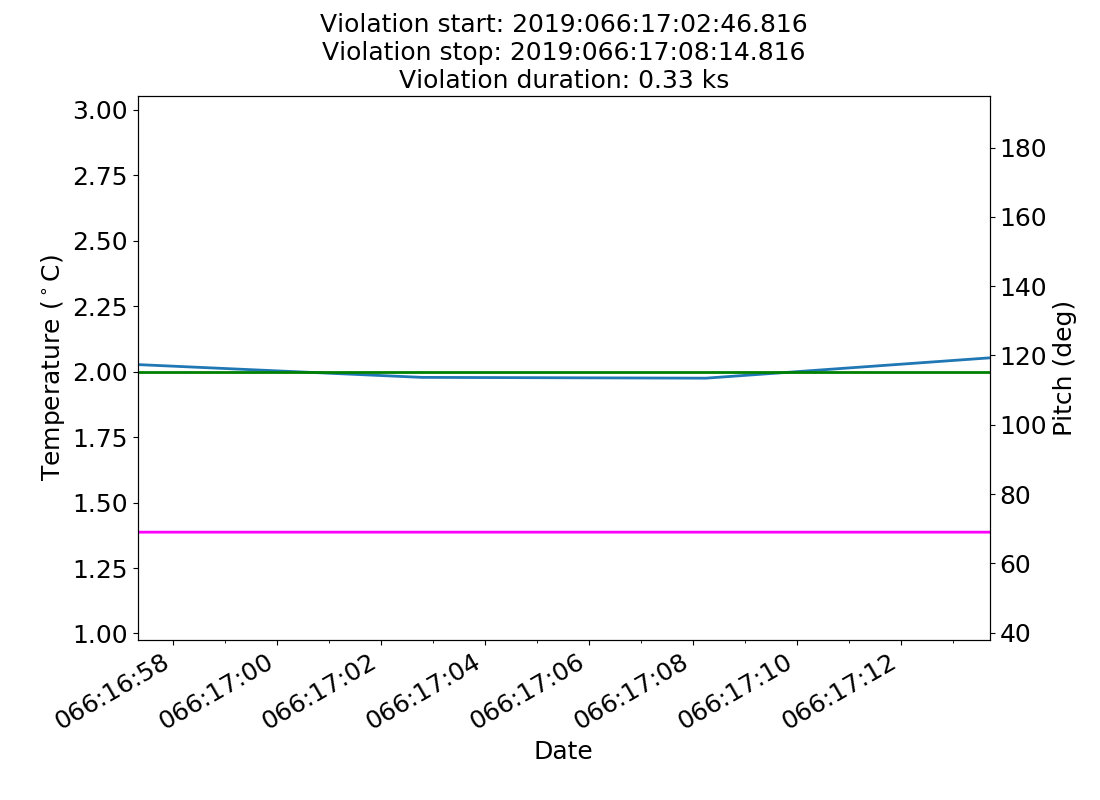
2019:066:17:02:46.816 |
2019:066:17:08:14.816 |
1.98 |
0.33 |
|
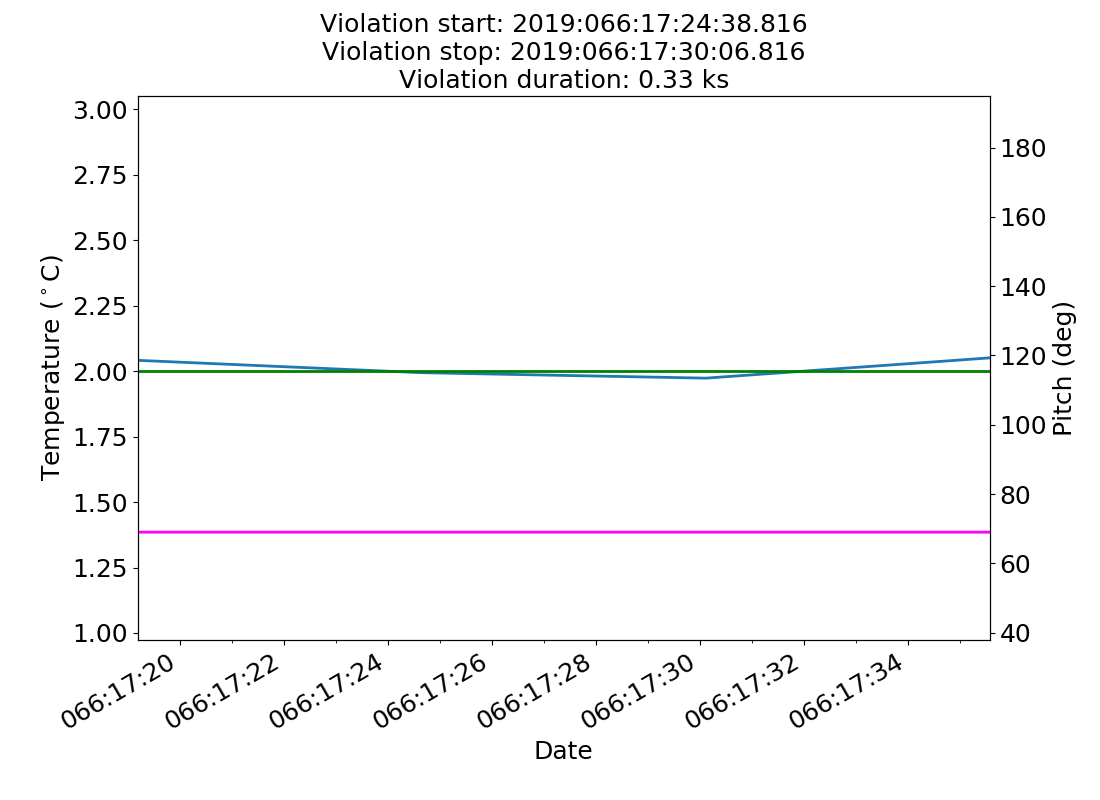
2019:066:17:24:38.816 |
2019:066:17:30:06.816 |
1.97 |
0.33 |
|
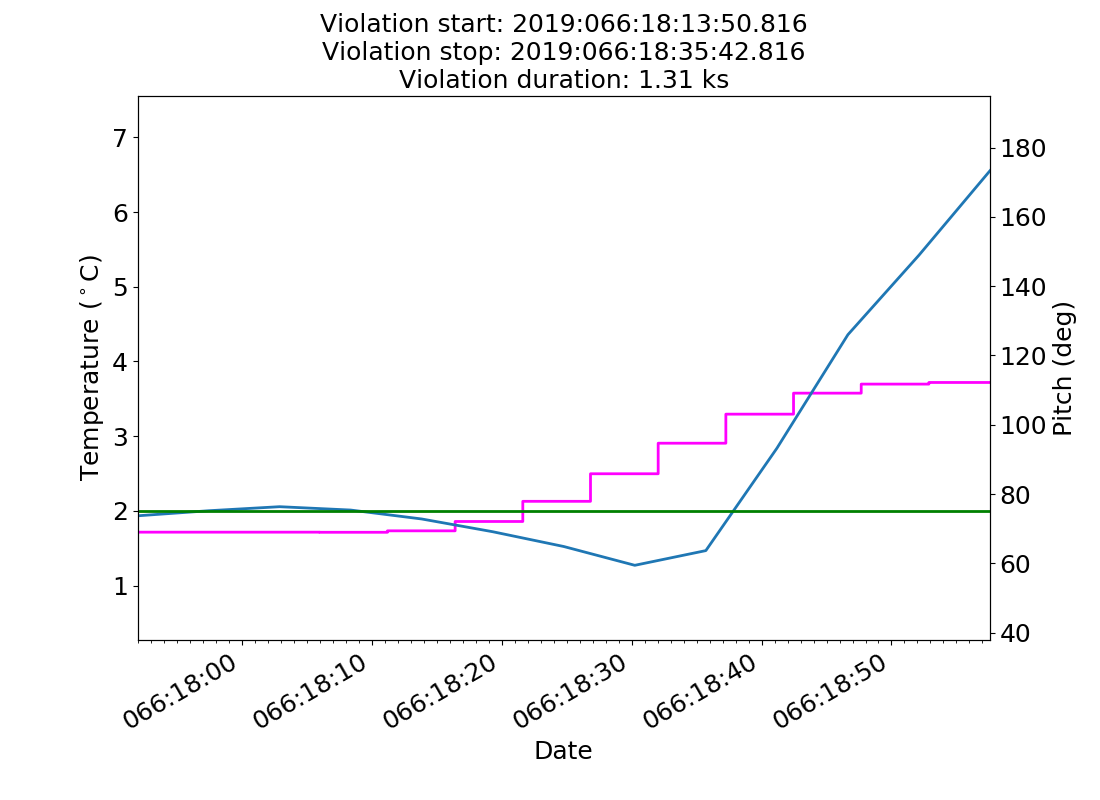
2019:066:18:13:50.816 |
2019:066:18:35:42.816 |
1.27 |
1.31 |
|
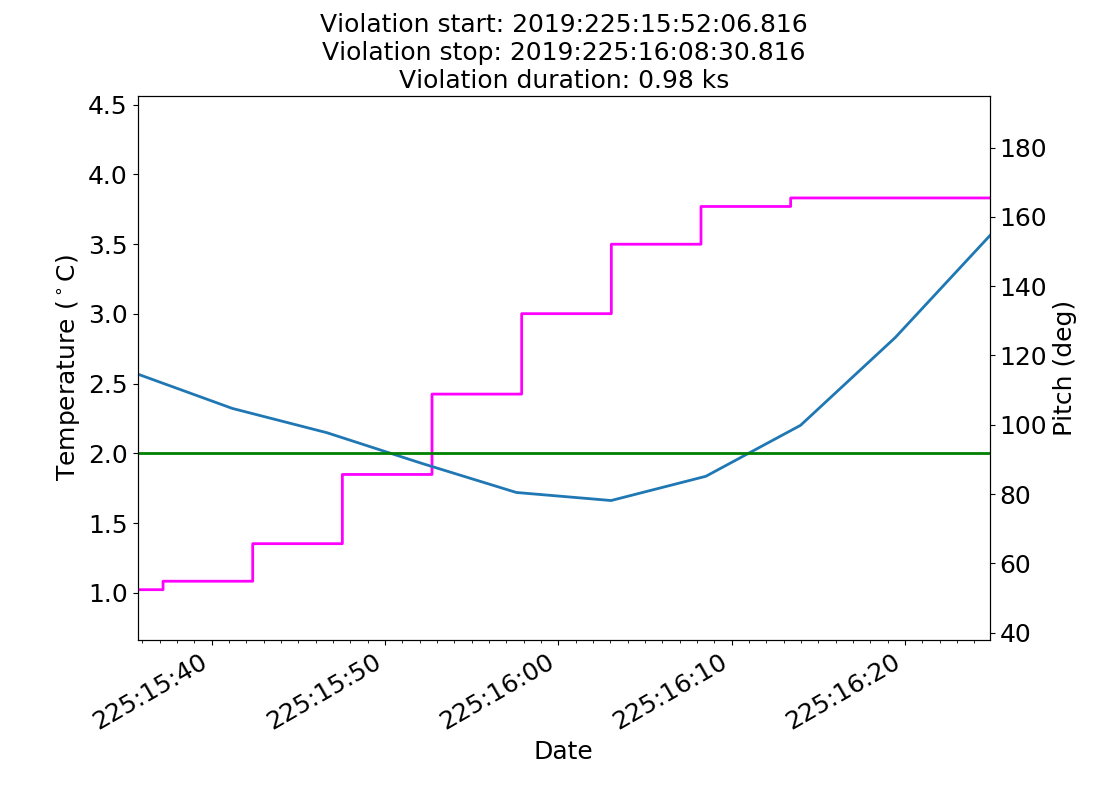
2019:225:15:52:06.816 |
2019:225:16:08:30.816 |
1.66 |
0.98 |
|
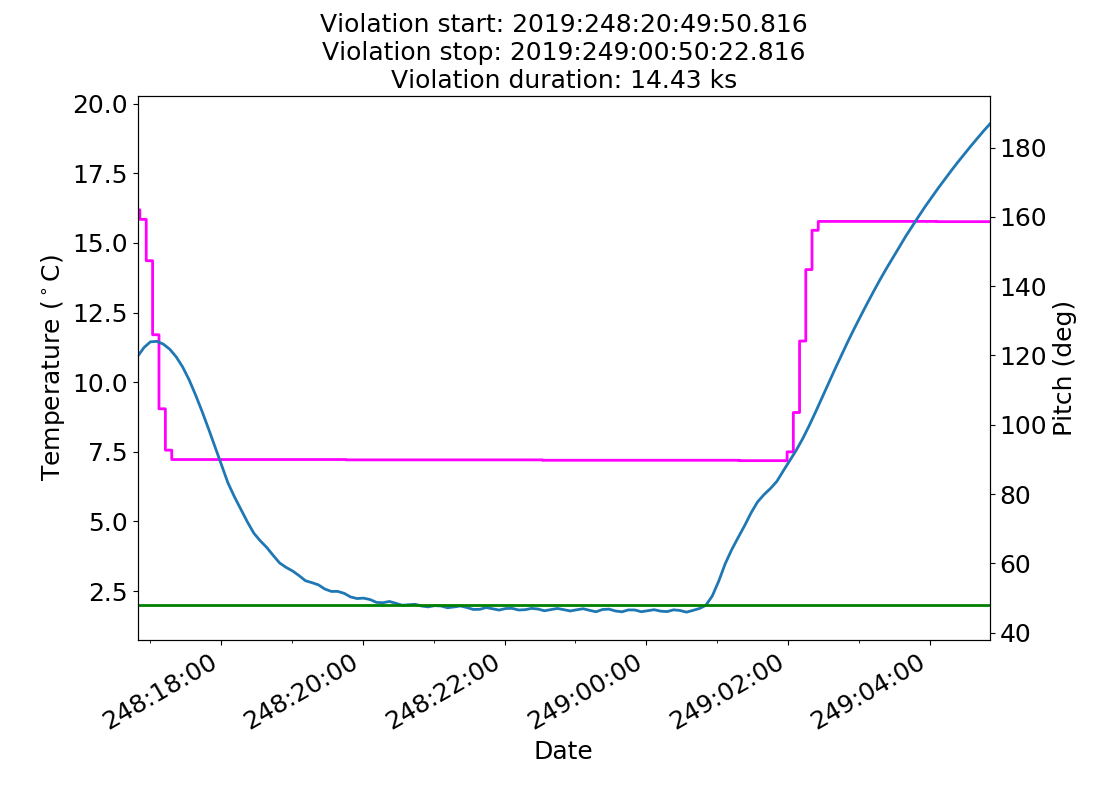
2019:248:20:49:50.816 |
2019:249:00:50:22.816 |
1.74 |
14.43 |
TMP_FEP0_FB Yellow Low Limit Violations
No yellow low limit violations during this period.
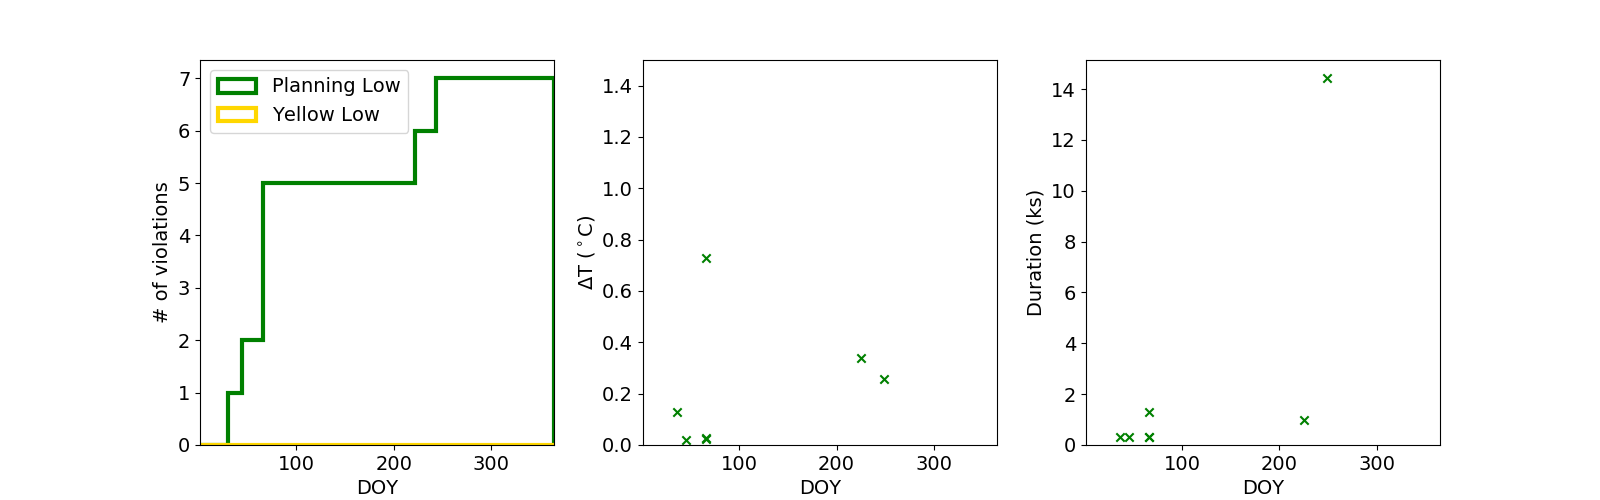
Low Violation Trends
This page was last updated at 2020:038:20:19:01.