Trumpler 14, obsid 4495, level 2 image
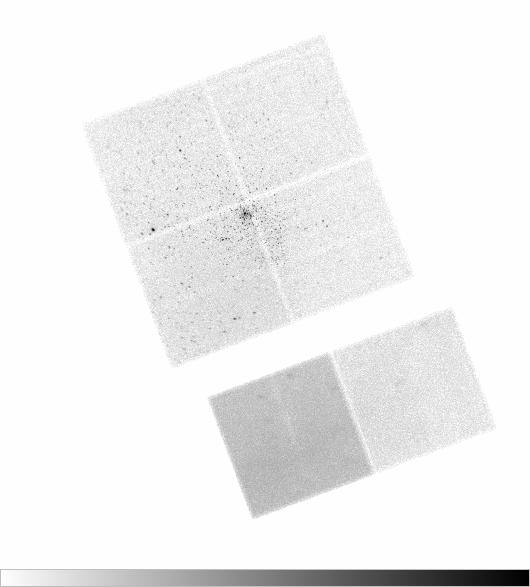
To help understand how the changes in the PHA/Energy conversions would affect real data, we also studied the Trumpler 14 data. This observation studied a low-mass star formation field and a diffuse soft X-ray emission. The field contains many low-mass pre-main sequence stars that emit in the soft X-ray regime.
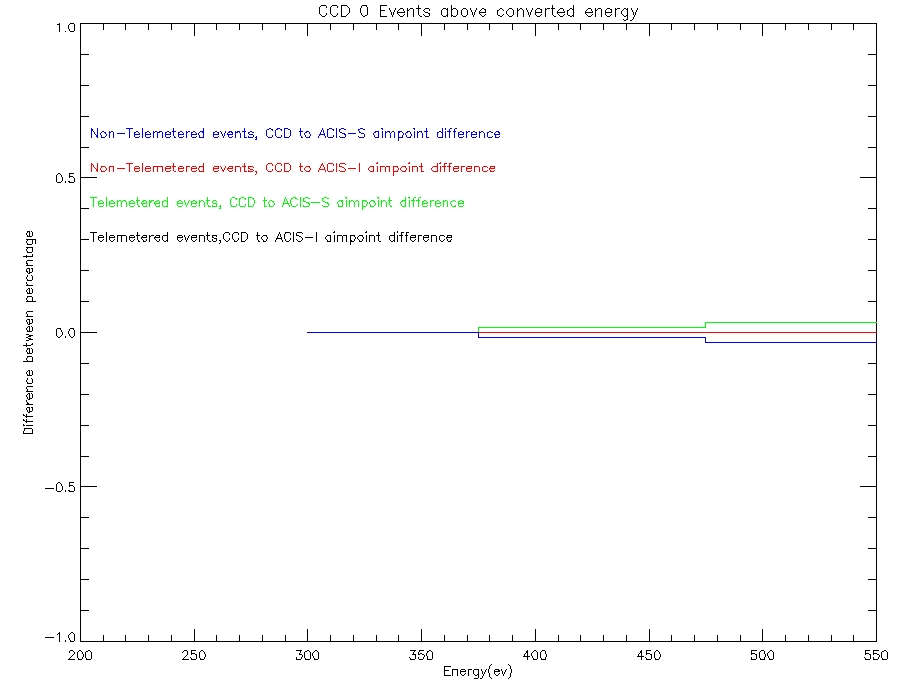
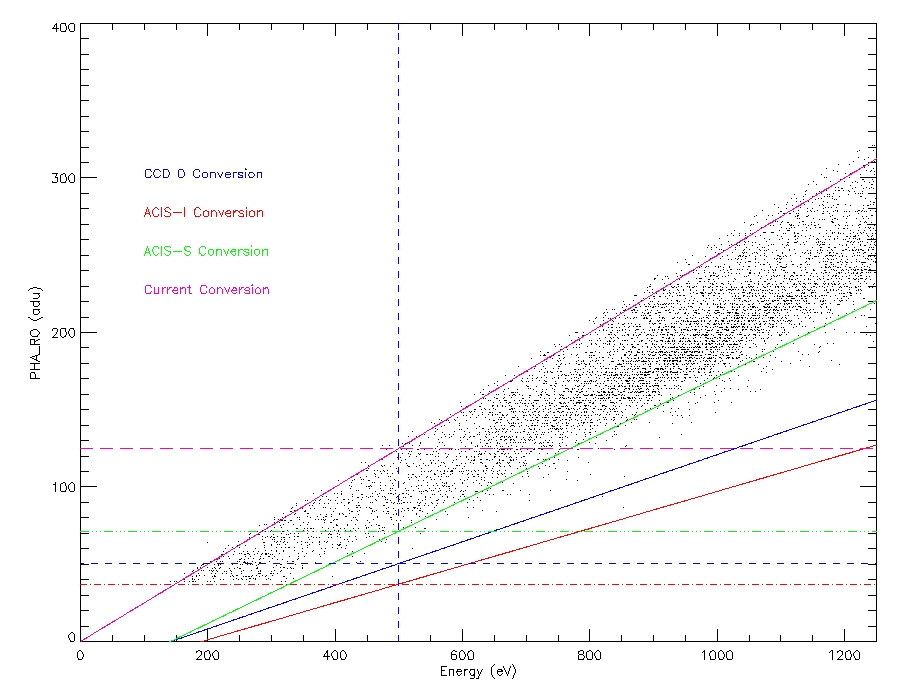
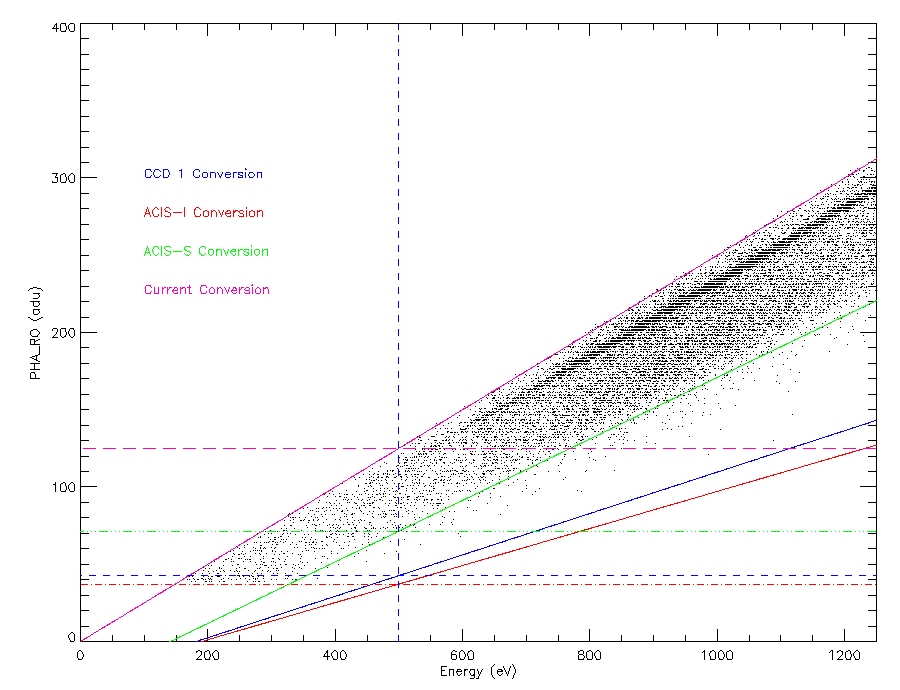
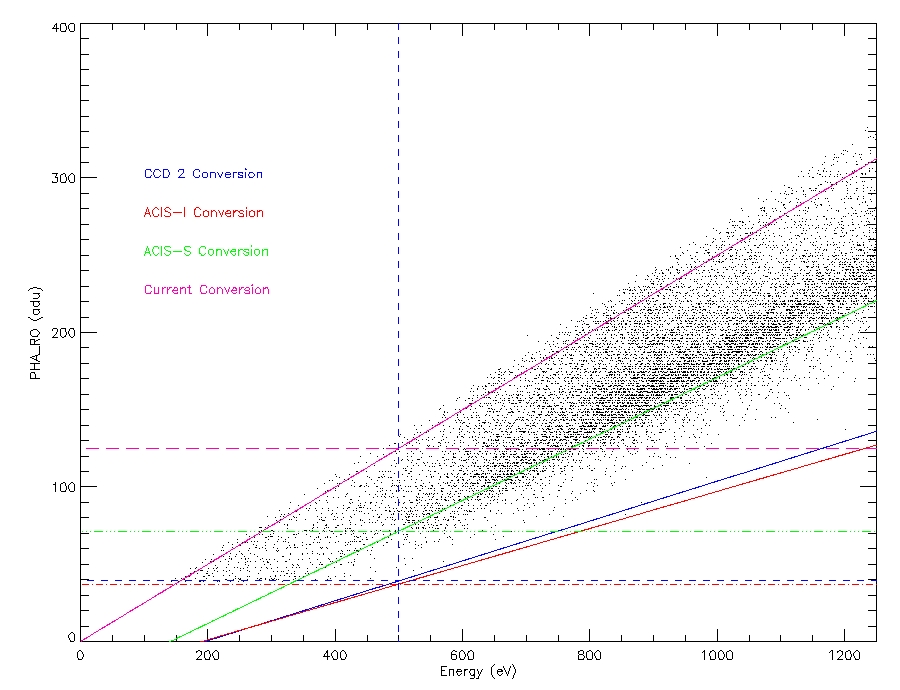
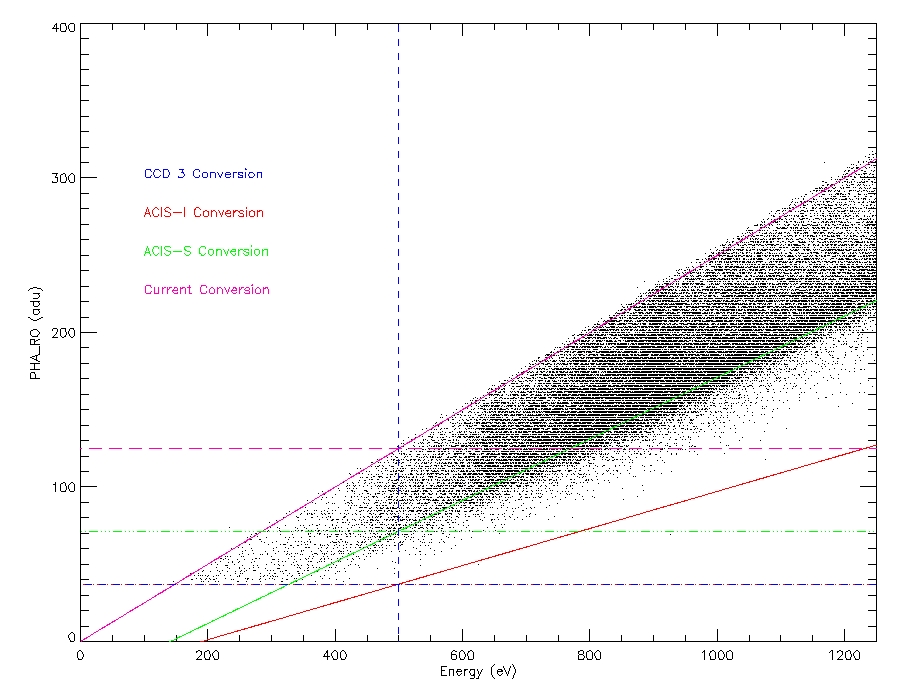
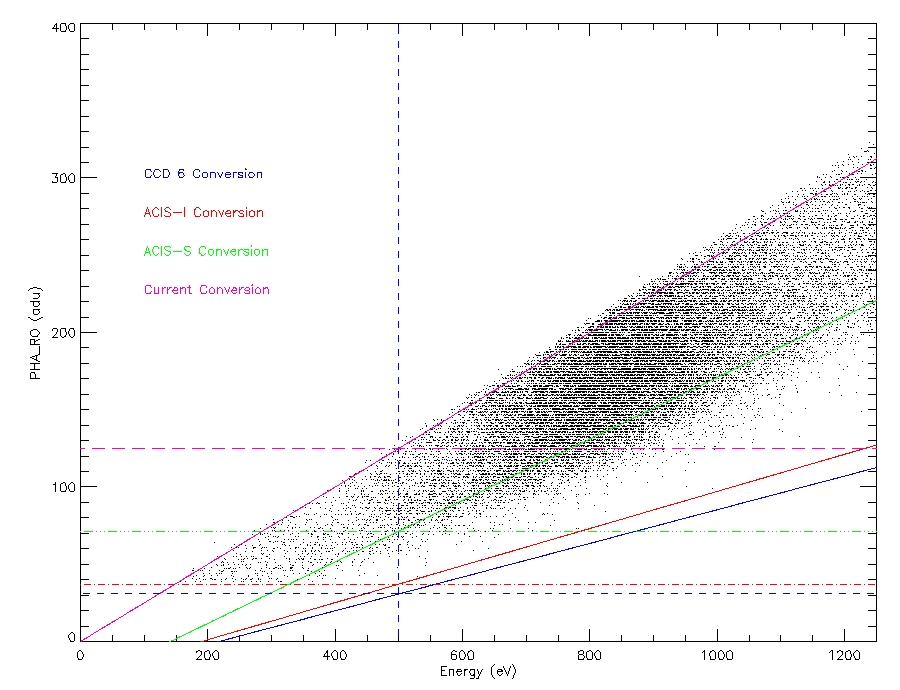
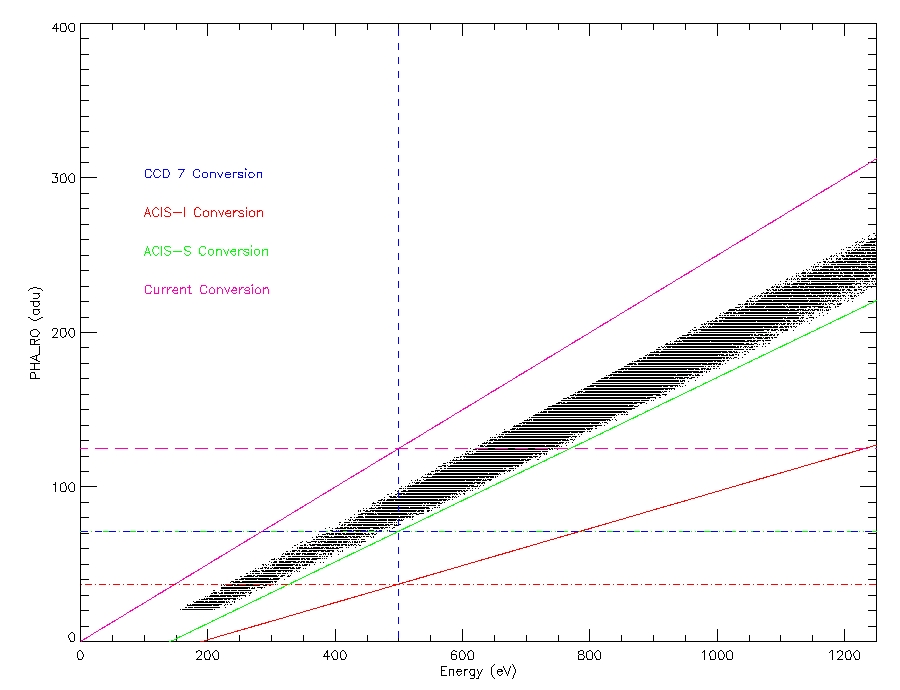
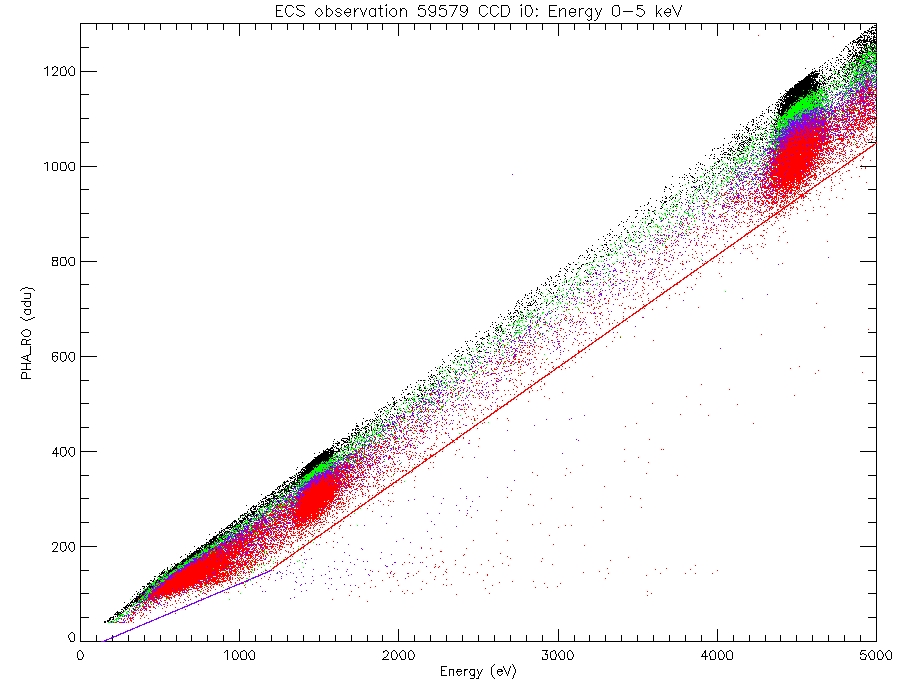
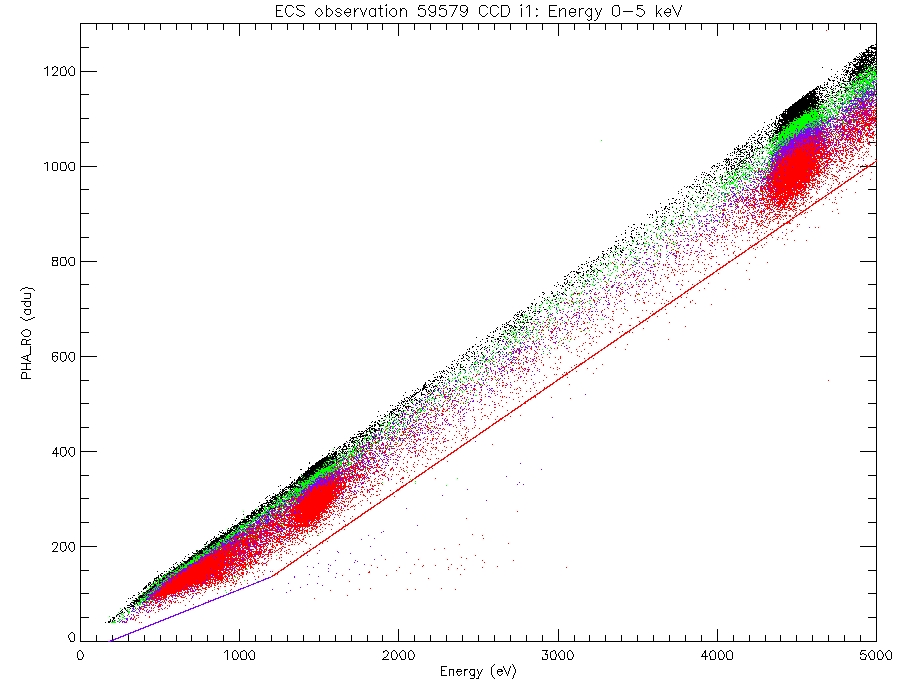
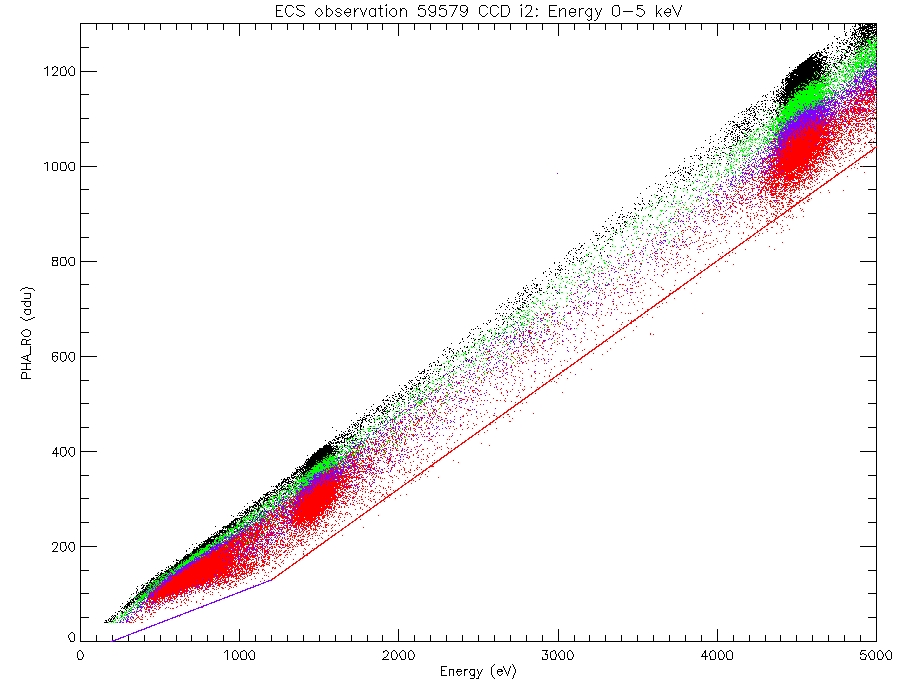
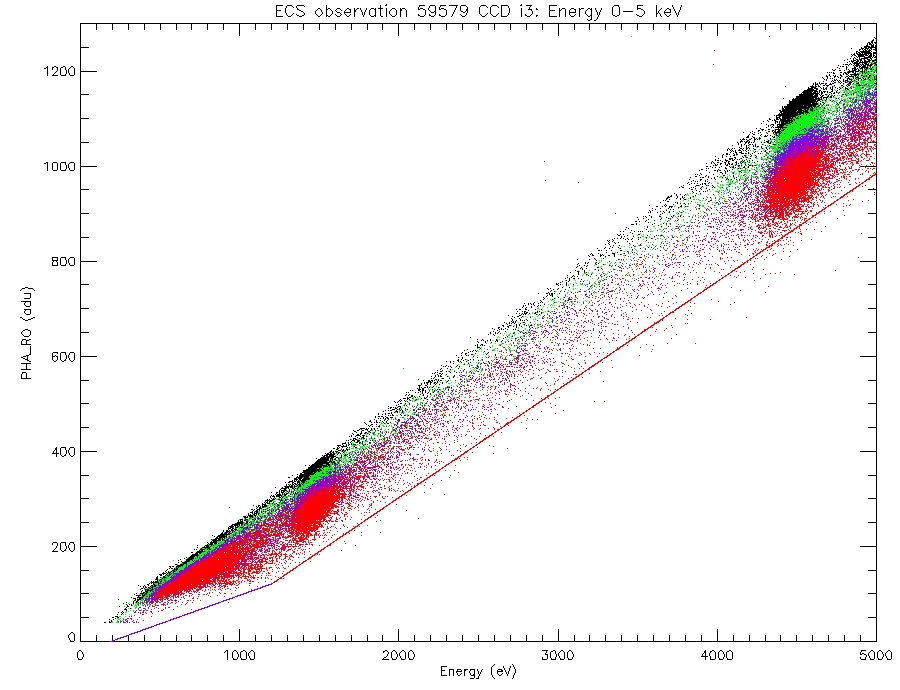
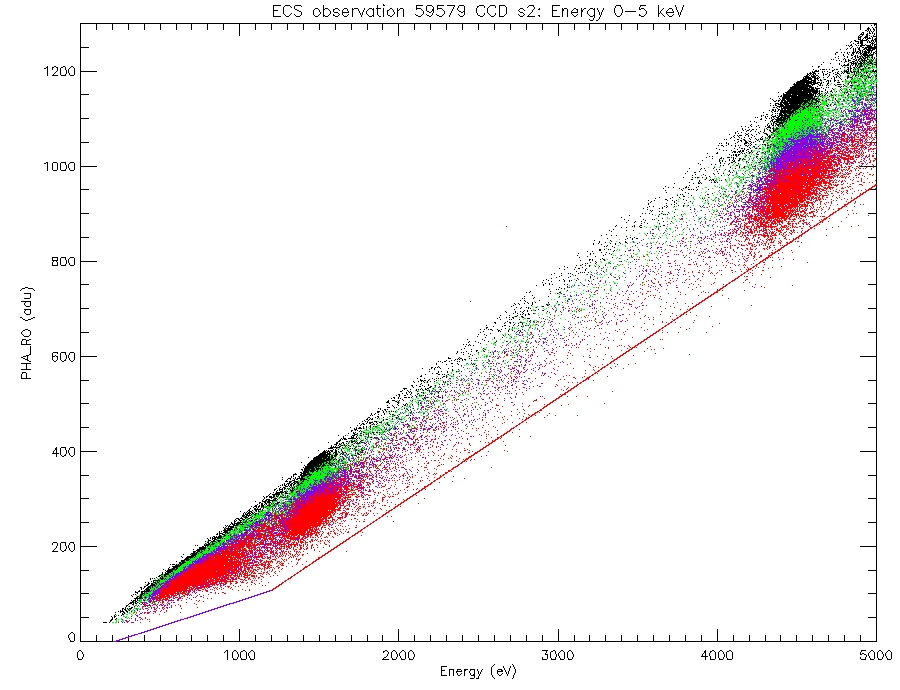
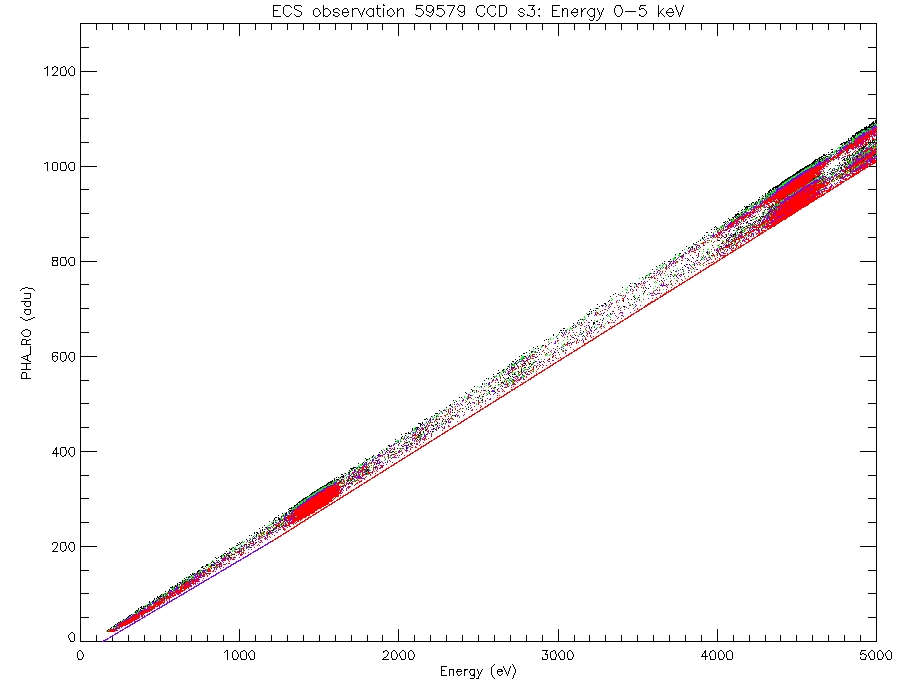
An added benefit of this field is the spatial distribution of sources. The sources are spread across the detectors which can show the true spread of the CTI when we examine PHA_RO (PHA read out, not corrected) versus assigned Energy(cti,t-gain corrected). The instrument setup can be seen with obsid 4495.
This field uses the I array, plus S2 & S3.
Trumpler 14, obsid 4495, level 2 image
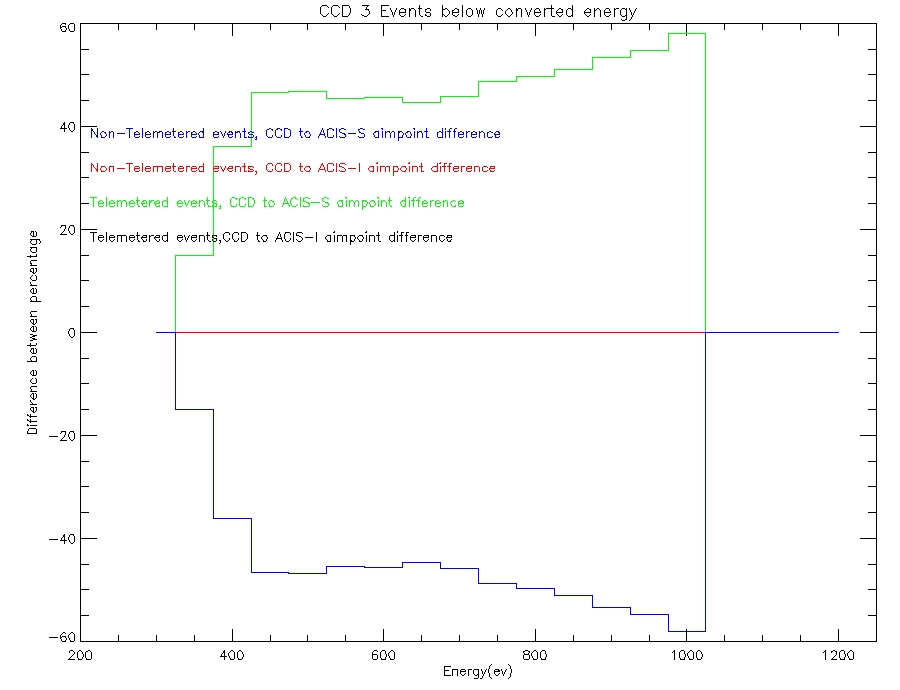
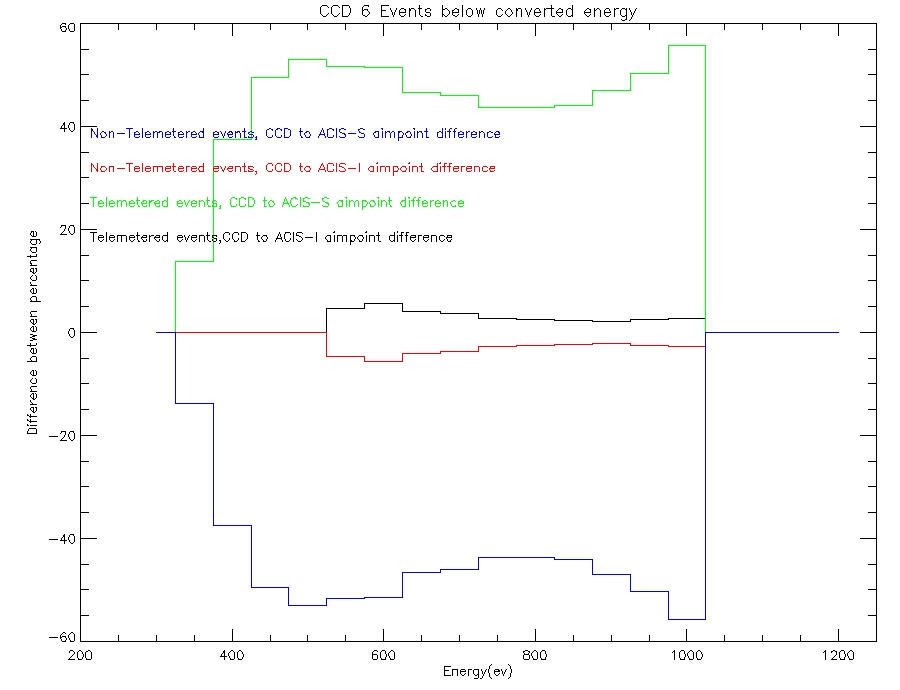
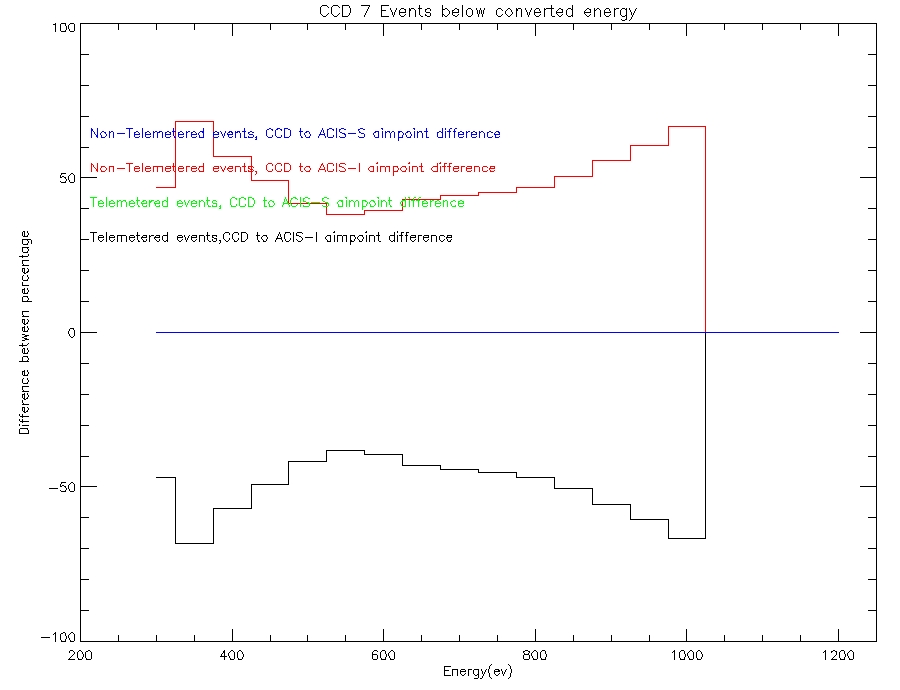
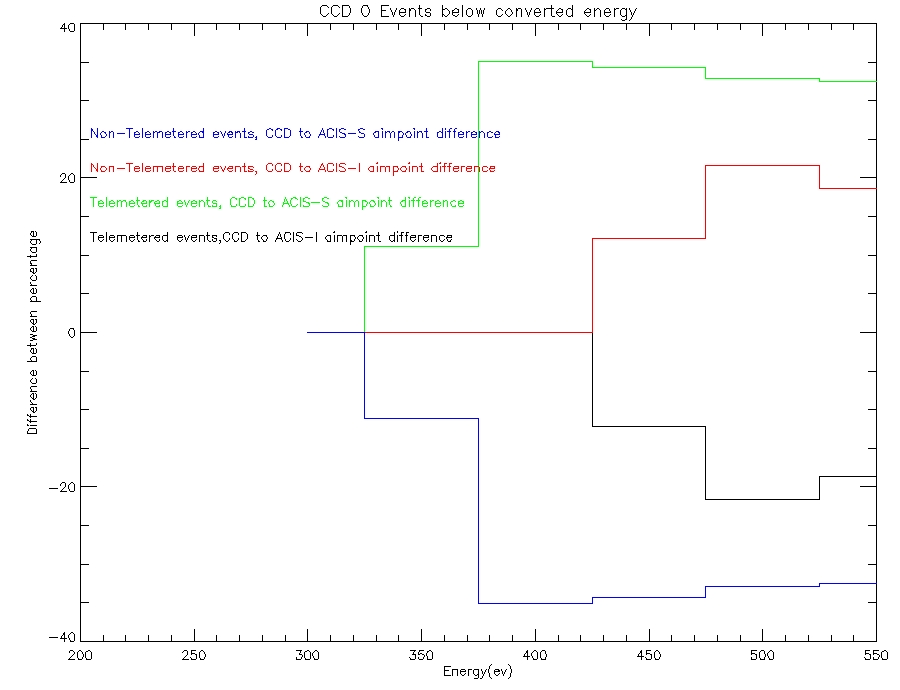
| Data BELOW the energy requested | |||||
|---|---|---|---|---|---|
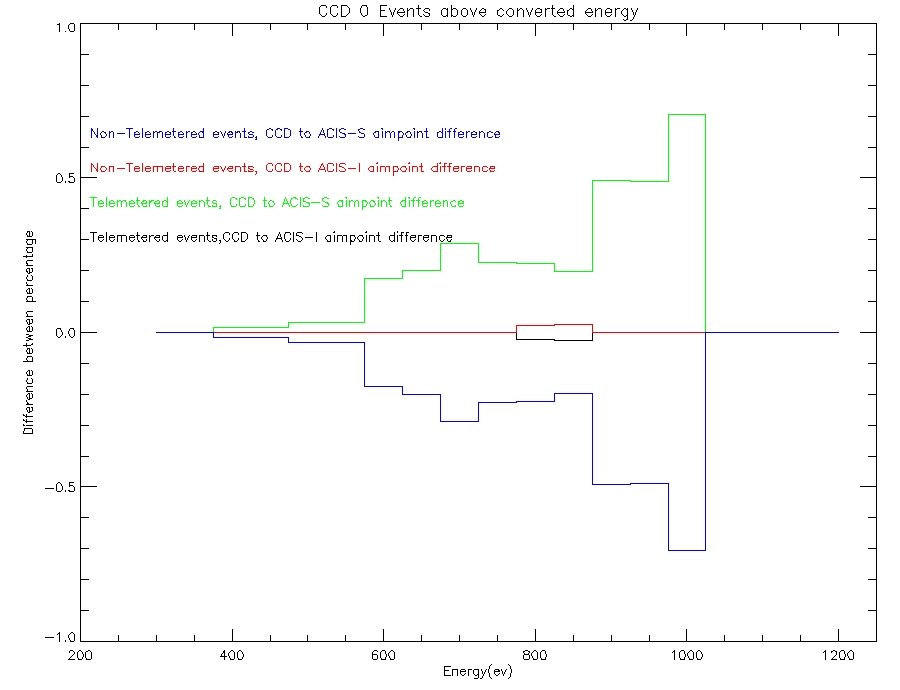
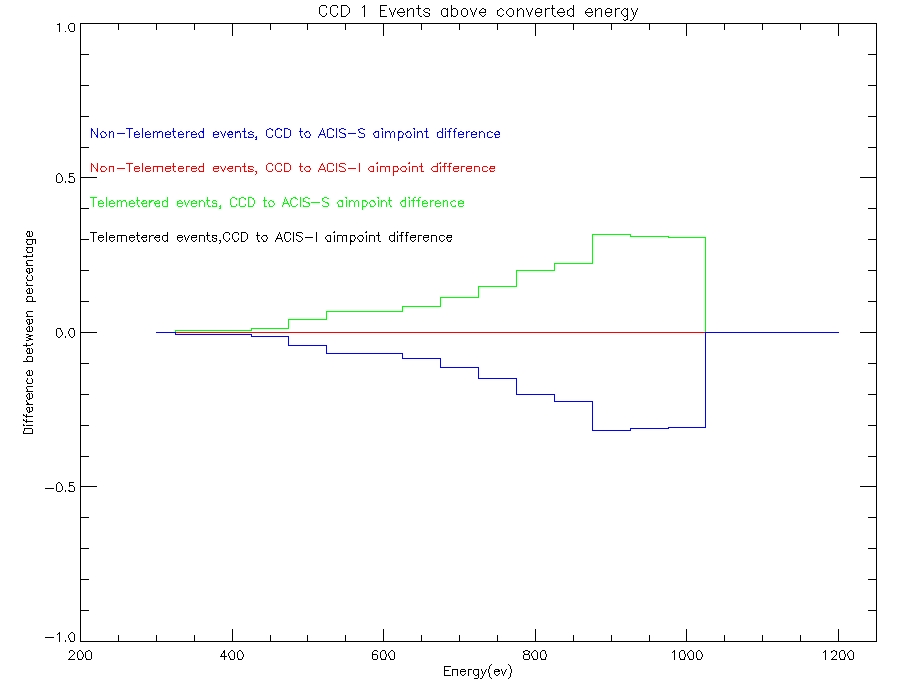
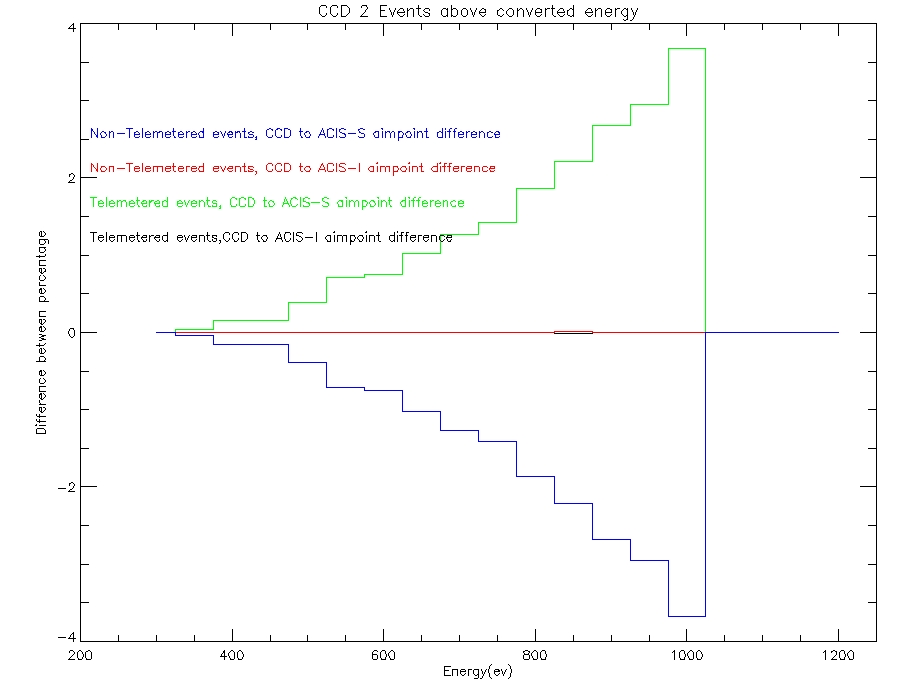
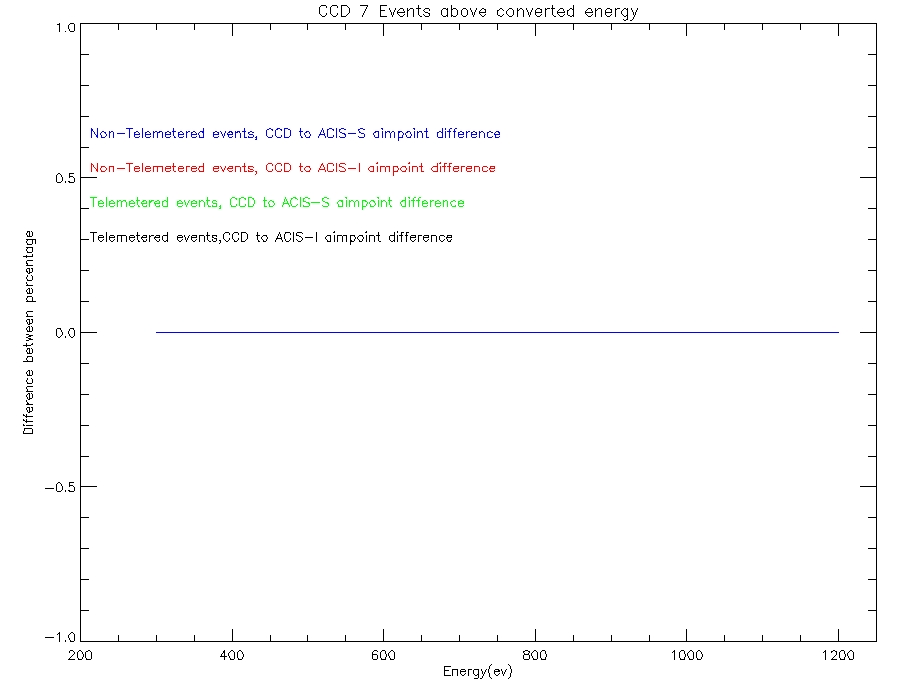
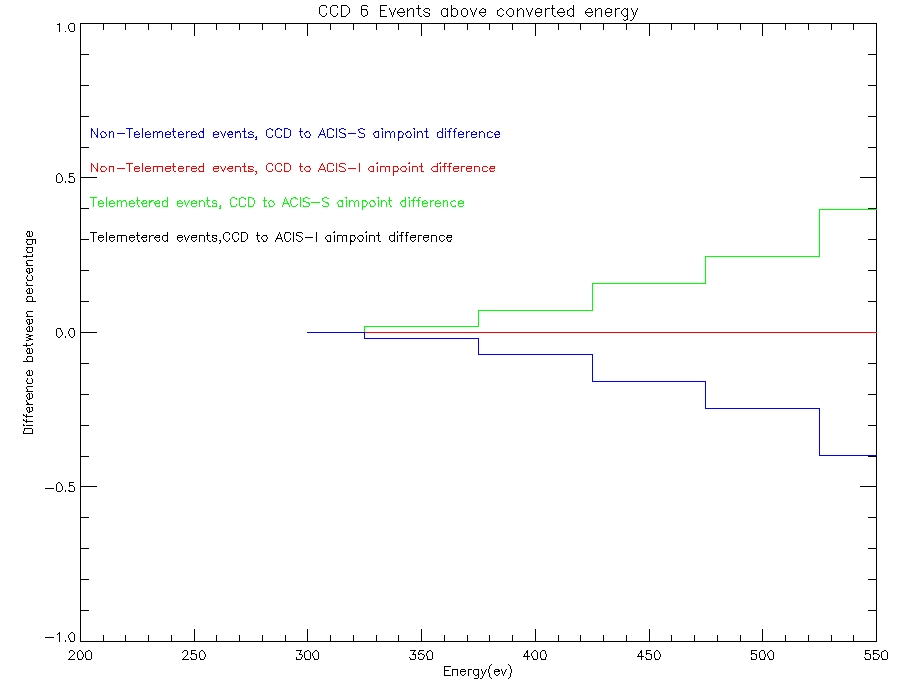
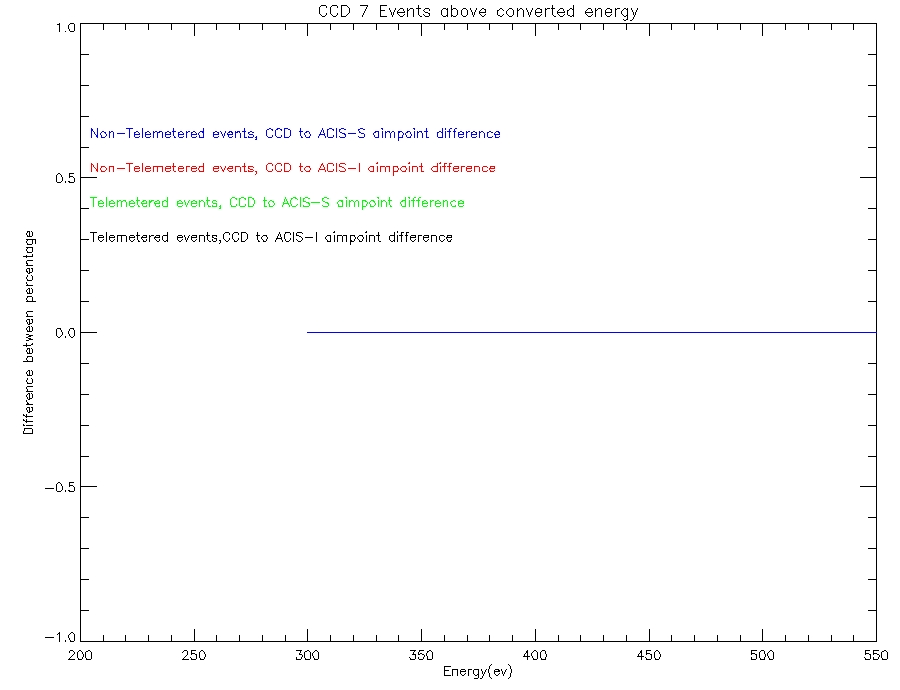
| Above the requested energy | |||||
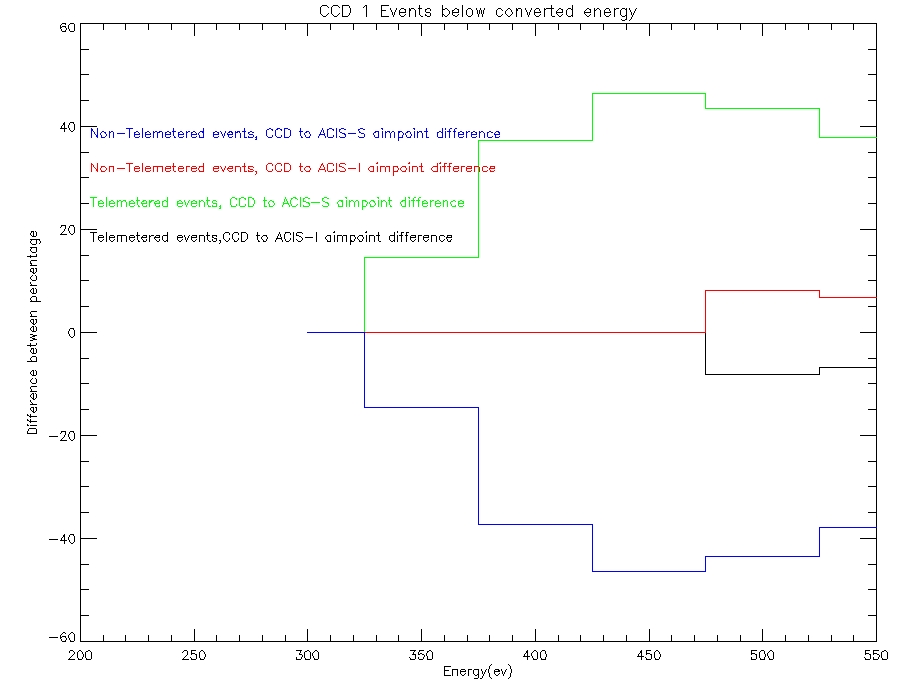
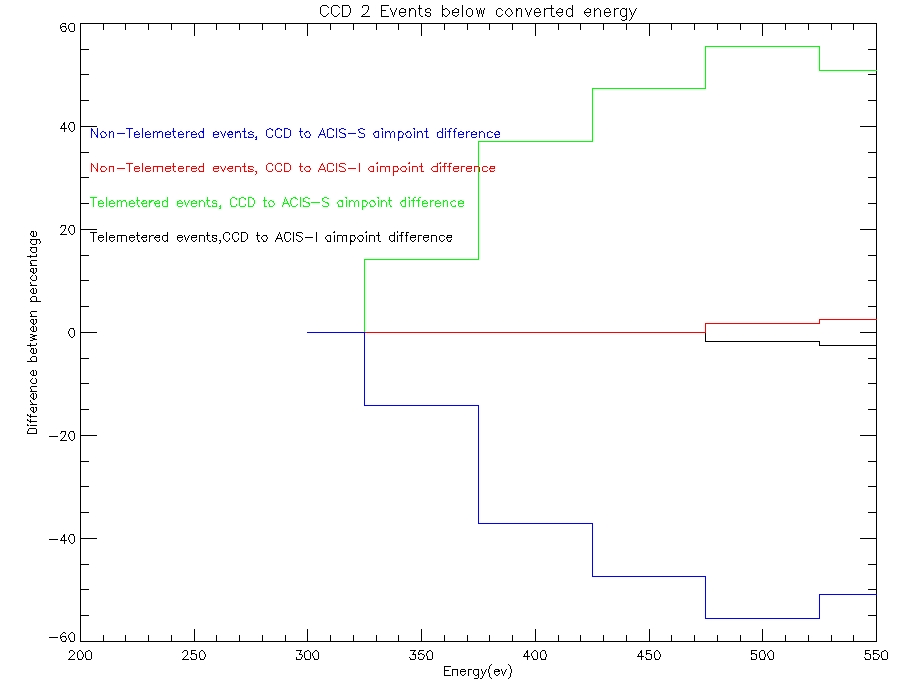
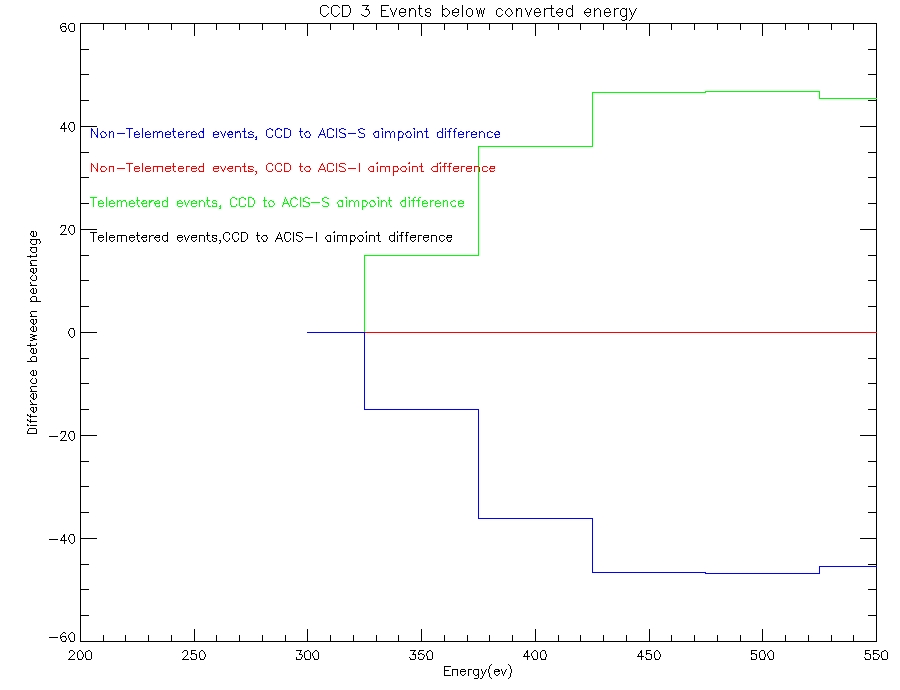
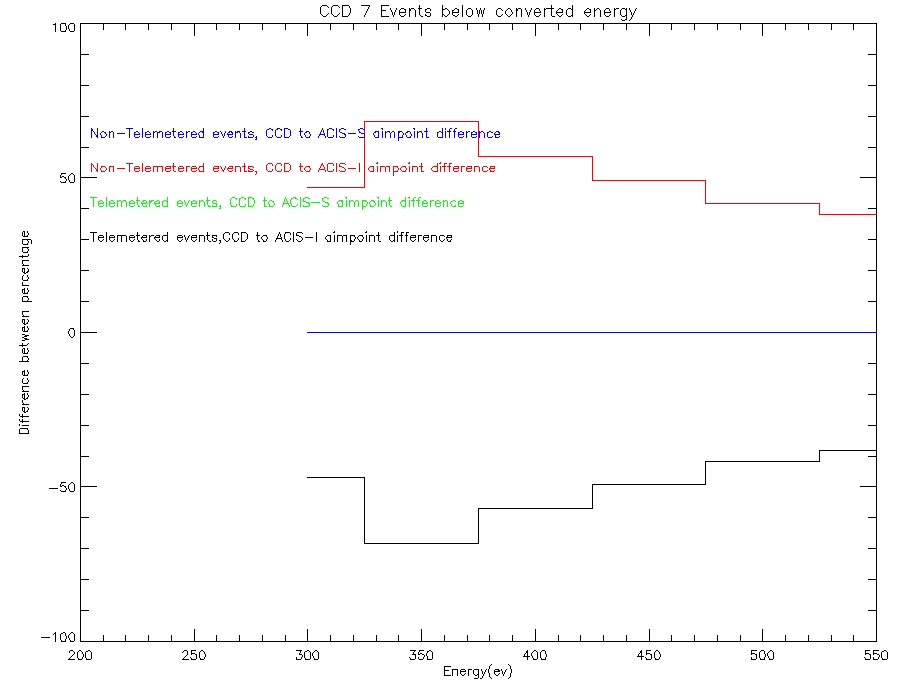
| Data BELOW the energy requested(0-0.5 keV) | |||||
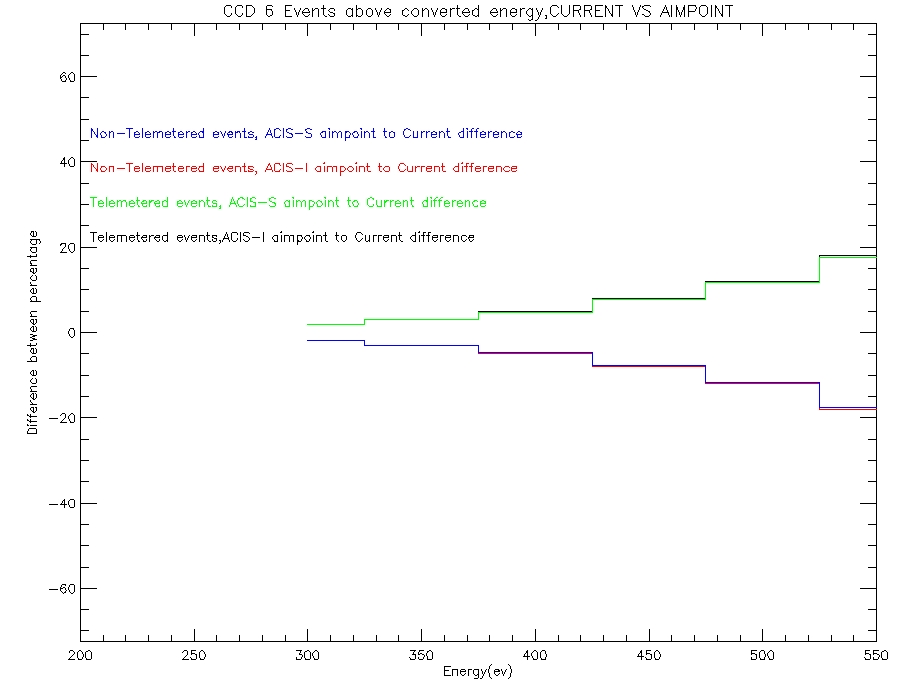
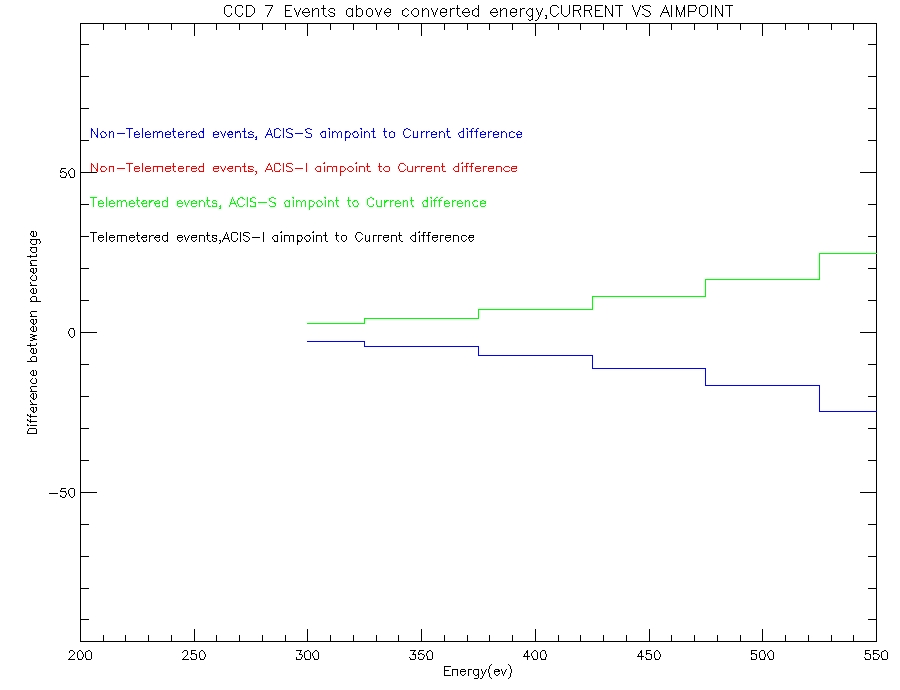
| Above the requested energy (0-0.5keV) | |||||
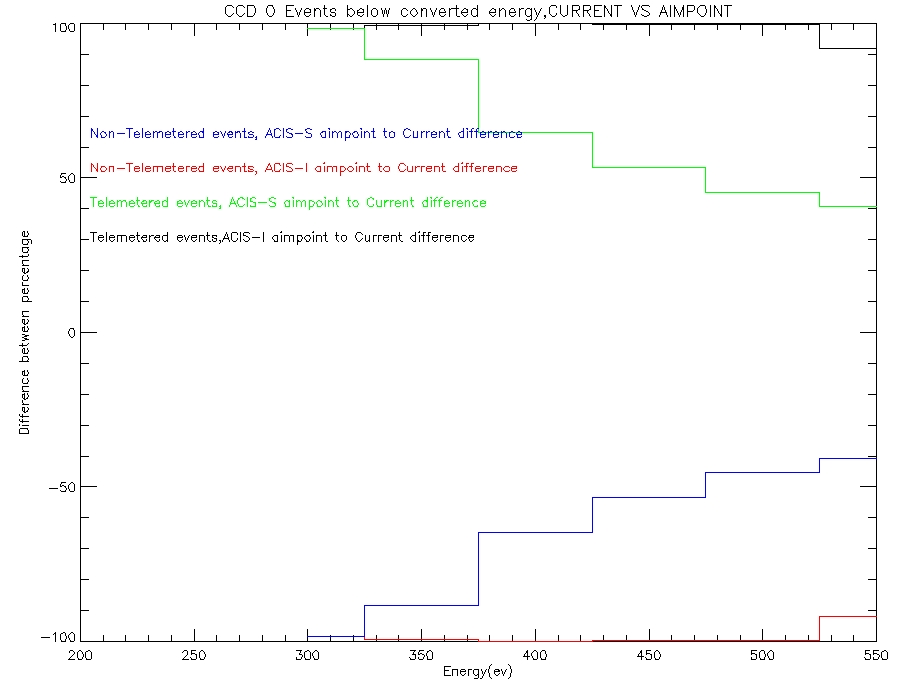
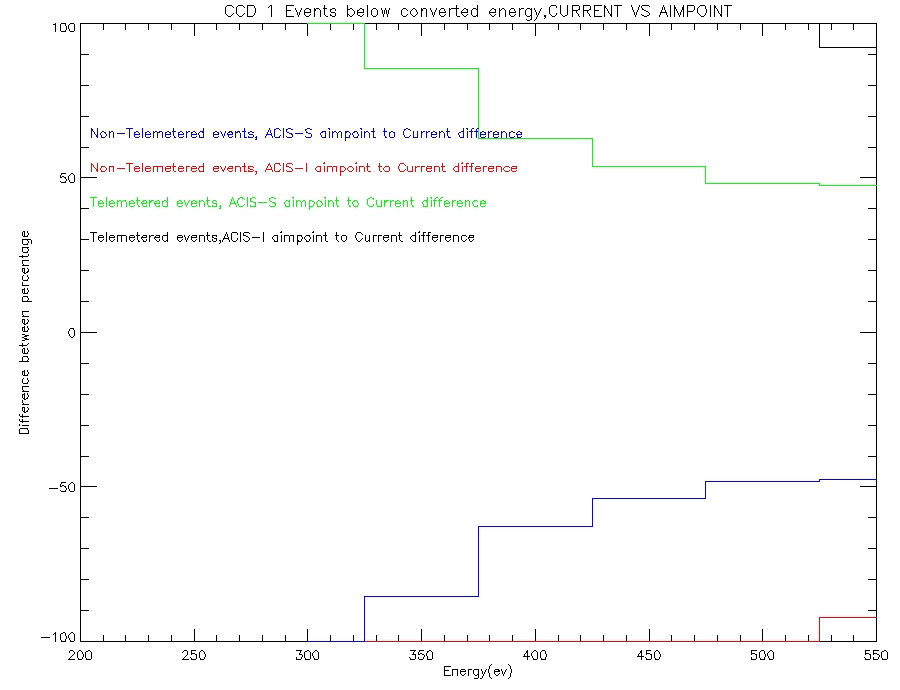
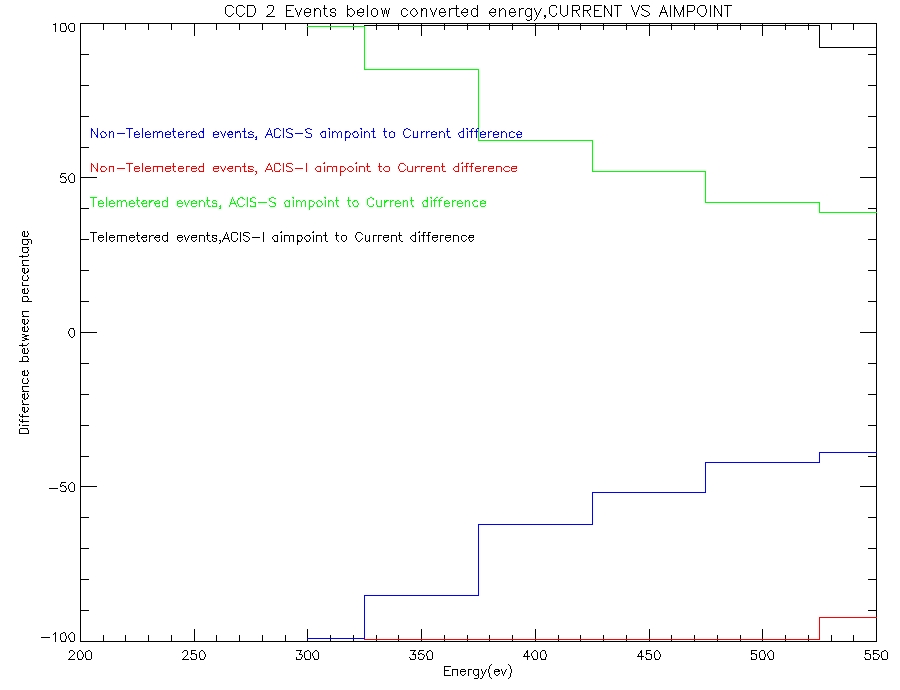
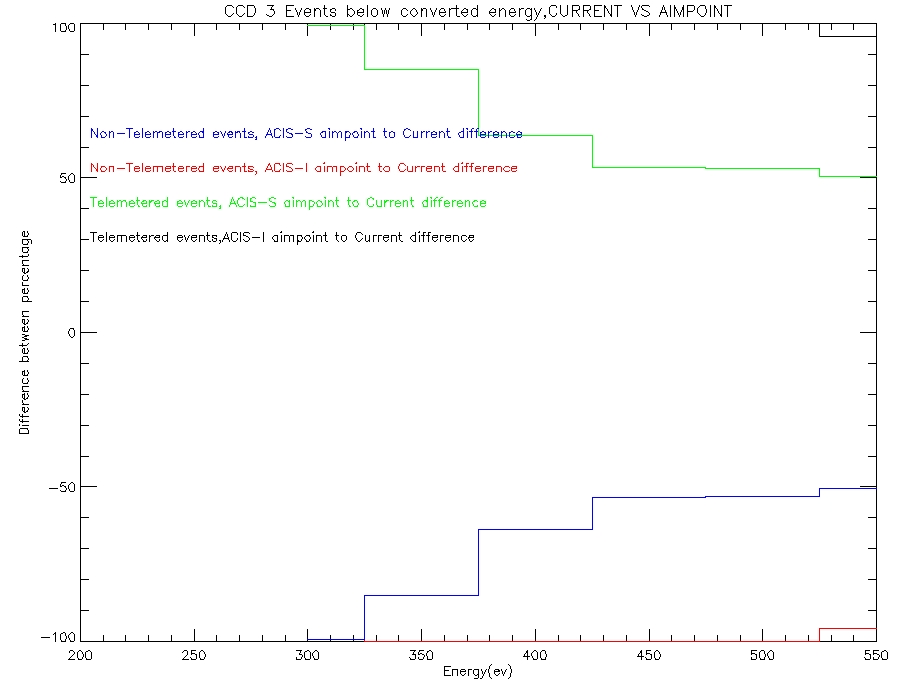
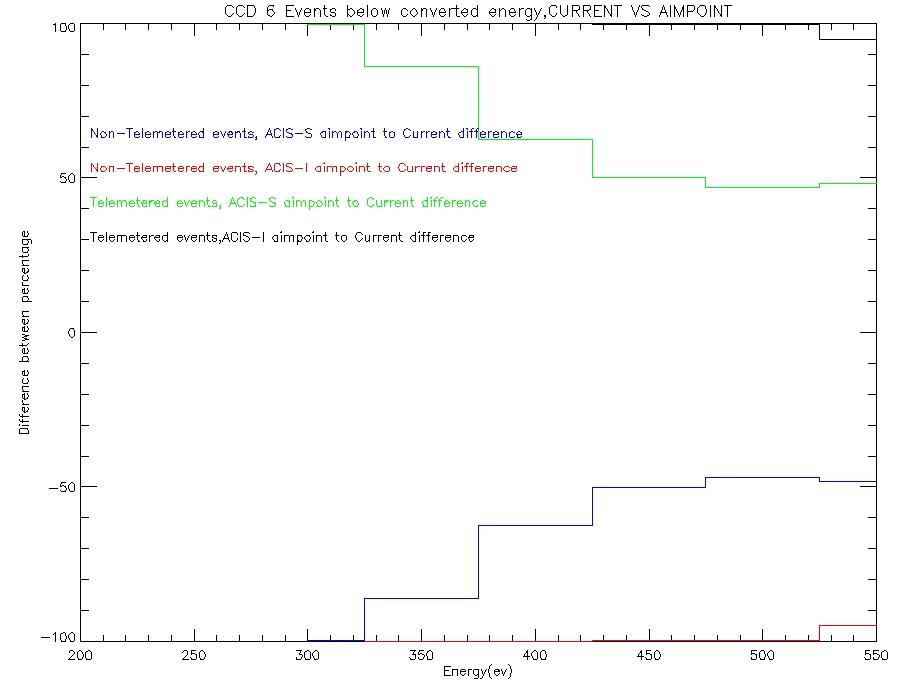
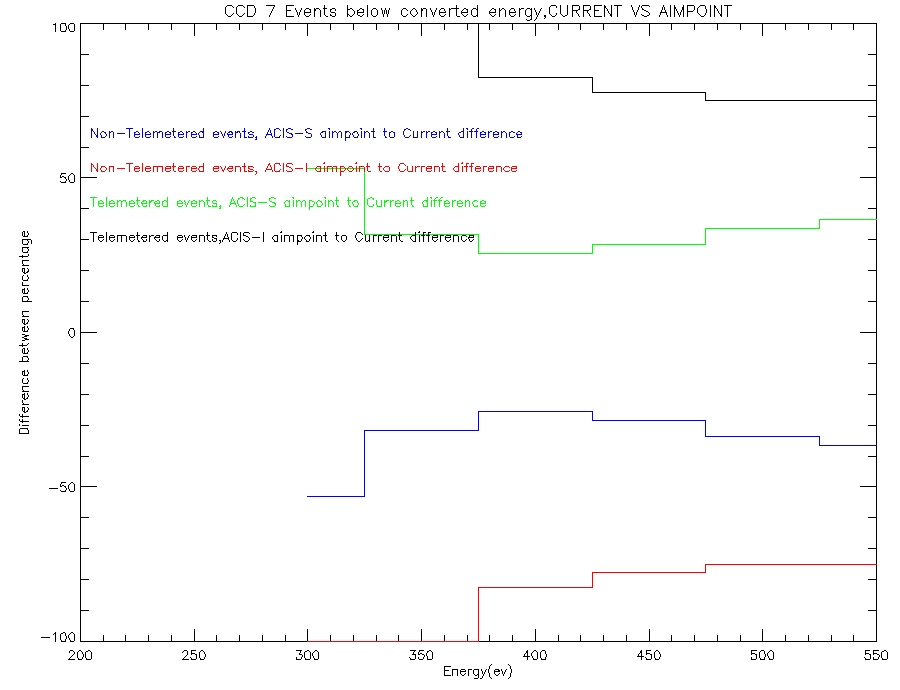
| Aimpoint-Current Data BELOW the energy requested(0-0.5 keV) | |||||
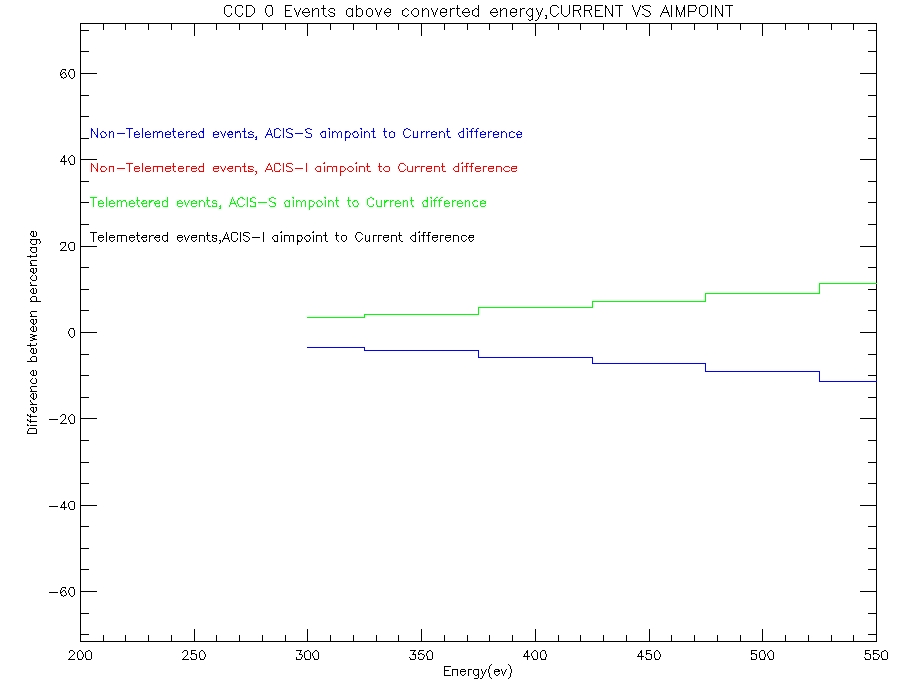
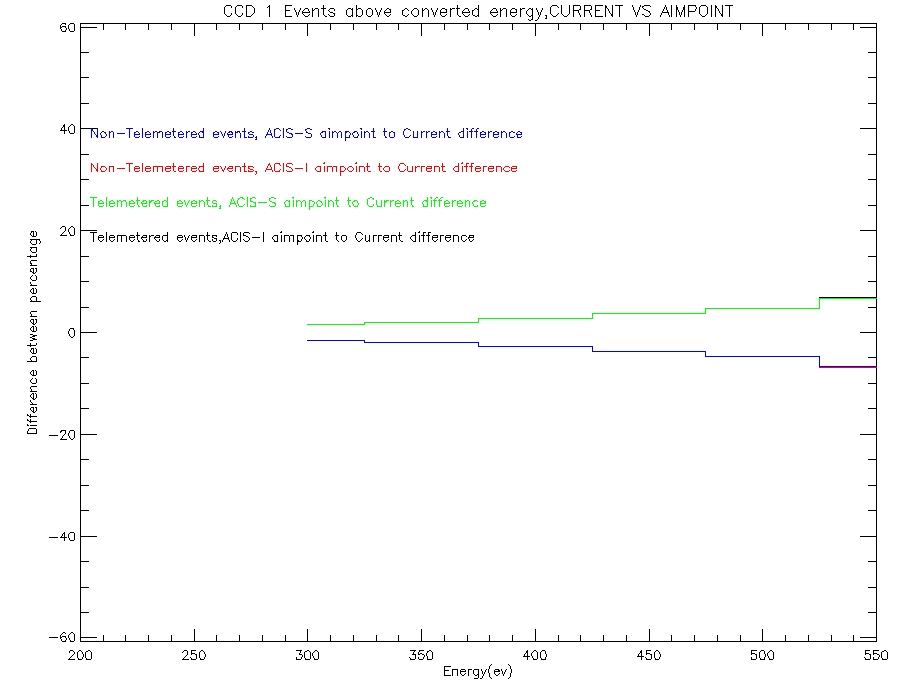
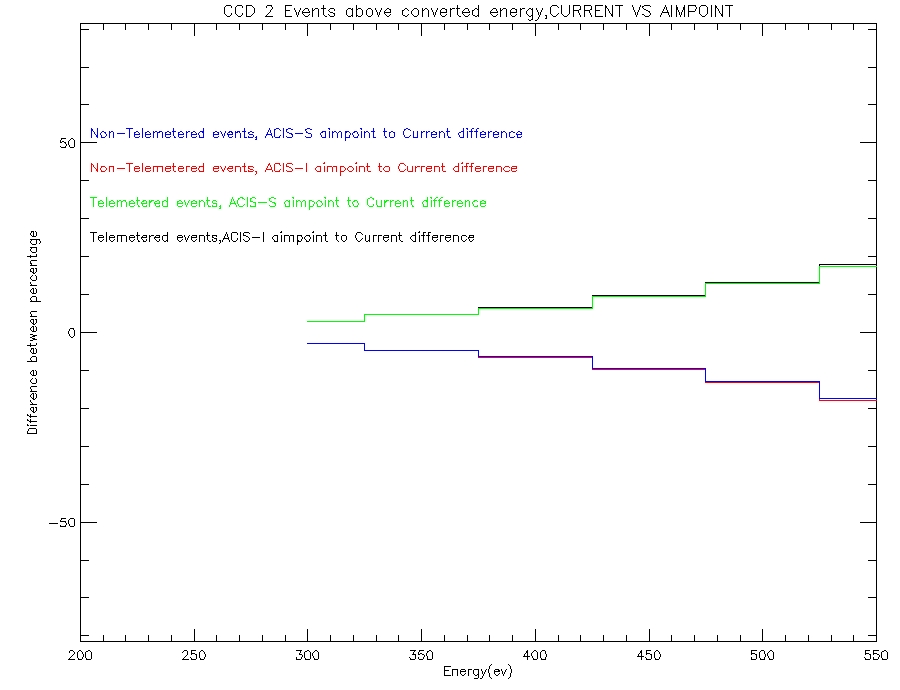
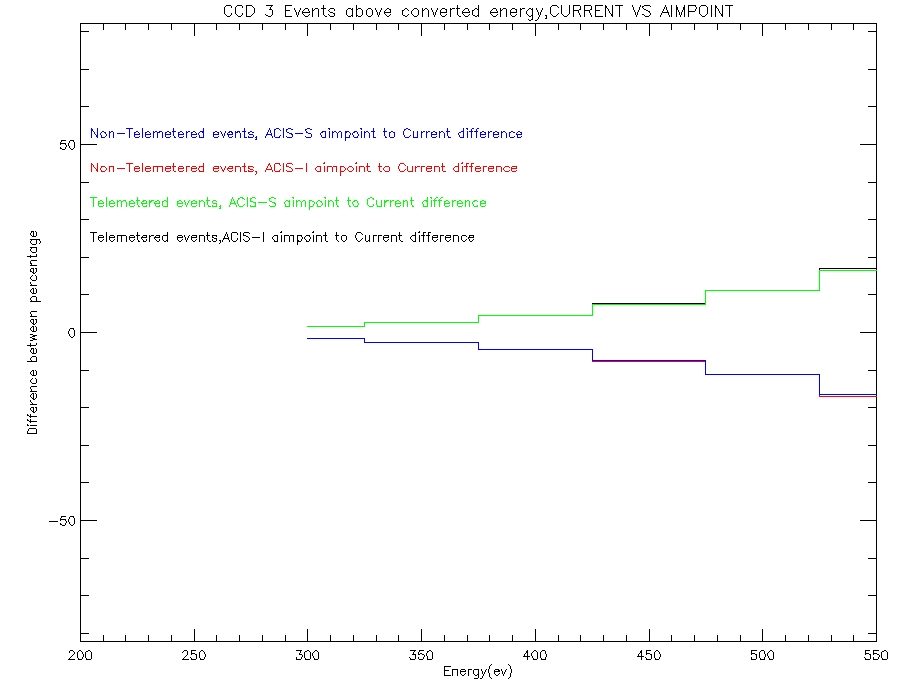
| Aimpoint - Current Data Above the requested energy (0-0.5keV) | |||||
| Diagrams of how ADU changes with conversion | |||||
| Data with the fits plotted 0.0-5.0keV | |||||