The Orion Nebular Cluster, obsid 4395, level 2 image
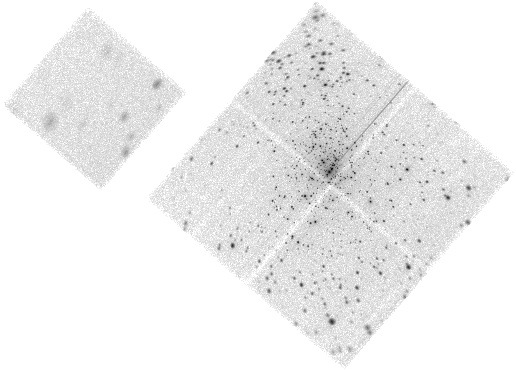
To help understand how the changes in the PHA/Energy conversions would affect real data, we looked at the COUP data, from the Orion Nebular Cluster. This is a series of 6 observations, totaling 850 ks. The field contains many low-mass pre-main sequence stars that emit in the soft X-ray regime.
An added benefit of this field is the spatial distribution of sources. The sources are spread across the detectors which can show the true spread of the CTI when we examine PHA_RO (PHA read out, not corrected) versus assigned Energy(cti,t-gain corrected).
An example of the instrument setup can be seen with obsid 4395.
A con of this field is that only FI detectors were used. However, this still allows us to explore the I-array responses and compare to the ECS data.
The Orion Nebular Cluster, obsid 4395, level 2 image
| Diagrams of how ADU changes with conversion | ||||
|---|---|---|---|---|
| Data with the fits plotted 0.0-5.0keV | ||||
| Data BELOW the energy requested | ||||
| Above the requested energy | ||||
| Data BELOW the energy requested(0-0.5 keV) | ||||
| Above the requested energy (0-0.5keV) | ||||
| Aimpoint-Current Data BELOW the energy requested(0-0.5 keV) | ||||
| Aimpoint - Current Data Above the requested energy (0-0.5keV) | ||||