Are We Getting Packets?.
Suppose you are wondering if the link between one or more of the ACIS Ops R/T machines:
- acisway-v
- aciscdp-v
- acis60-v
- ishmael
Reminder: Each of those 4 machines are listening to the GOT via 2 datagram sockets: socket numbers are 15000 (R/T web page) and 16000 (PMON).
Each machine gets its own 15000 and 16000 port. So that's why you have to log onto the specific machine you want to test.
It's important to remember that only one process can access each socket at a time. So when you want to test a socket you have to shut down the process(es) presently using that socket. You must also prevent the cron jobs from trying to restart those processes. For example, this cron job:
/export/acis-flight/acis/bin/acis-acorn-check.pl
...checks every 5 minutes to see if an acorn process is running. If it is not, it activates a new process. If you want to test the socket that feeds telemetry data to the acorn process (socket number 15000), on a particular machine, then you need to kill this cron job on that machine.
The simplest way is to kill all cron tasks with:
crontab -r.
Here is how you test a socket:
- Log on to the machine in question as acisweb.
- Stop all Cron jobs by issuing "crontab -r"
- Kill the appropriate process(es) for the socekt number under
investigation. If you want to test the feed to the R/T web pages
that would be socket number 15000. So you would kill the acorn
process which is running.
If you want to test socket number 16000 then kill the PMON CRON processes on the node in question.
To kill the process(es) you first have to ascertain their PID number. Execute a "ps -u acisdude -f"; note all R/T processes relevant to the R/T web pages and PMON (e.g. getnrt,catnrt, pmon, or acorn) and kill them (kill -9 pid).
- cd to /export/acis-flight/UTILITIES
- Execute the following command: "Port_Listener
" For example, to test port number 15000 (15000 is the default), type:
Port_ListenerTo test port number 16000 or any other port number, type:
Port Listener -p 16000
- At the start, running on aciscdp-v, what you will see is this:
- But if the connection to the GOT is good and data is being
transferred then you will then see a series of report lines
telling you the size of the packet.
I am: aciscdp-v.cfa.harvard.edu Port Number: 15000 Opening file: rawUDPdata15000aciscdp-v.cfa.harvard.edu81619RTcomm.1252 Entering WAITING loop: time.struct_time(tm_year=2019, tm_mon=8, tm_mday=16, tm_hour=12, tm_min=52, tm_sec=1, tm_wday=4, tm_yday=228, tm_isdst=1) Killing time - len data: 58 hour: 12 min 25 sec 15 Killing time - len data: 58 hour: 12 min 25 sec 16 Killing time - len data: 58 hour: 12 min 25 sec 17 ...................Now, if we are NOT in real time Comm, the packet size will be 58. This is the heartbeat packet that the COG always sends out if we are not in Comm. So if you see these lines you know the connection is good
And it will go on like that forever until you hit Control-C.. - If we ARE in Comm, you will see a packet size of 1024:
- If you time it carefully, you can be watching the print outs switch from a packet size of 58 to 1024 (when the telemetry stream begins); or 1024 to 58 (when the telemetry stream ends).
- If you see either the 58 or 1024 packet size (as appropriate) then you know the link is ok. If the link is not ok, the display will simply hang. You get a new line roughly once per second.
- And that's all there is to it. When done be sure to control-C out
of the program. AND be sure to restart the cron jobs. To do that you cd to:
cd /export/acis-flight
...And then start the cron jobs:
crontab LINUX_crontab_static.txt
    aciscdp-v.acisdude:UTILITIES[122]> Port_Listener

    I am:  aciscdp-v
    Port Number is:  15000
If you forgot to kill the process using that port, you will get an error message which ends with this line:
socket.error: [Errno 98] Address already in use
If no data is coming across the port, you will see this:
           I am:  aciscdp-v.cfa.harvard.edu
           Port Number:  15000

           Opening file:  rawUDPdata15000aciscdp-v.cfa.harvard.edu81619RTcomm.1252

           Entering WAITING loop:  time.struct_time(tm_year=2019, tm_mon=8, tm_mday=16, tm_hour=12, tm_min=52, tm_sec=1, tm_wday=4, tm_yday=228, tm_isdst=1)
....and it will sit there like that forever until you control-C
out of it.
- Note that it will store any data it gets in a file.
           Acq loop, data length: len data: 1024 hour:  12  min   25  sec   15
	   Acq loop, data length: len data: 1024 hour:  12  min   25  sec   16
	   Acq loop, data length: len data: 1024 hour:  12  min   25  sec   17
           ...................
And it will go on like that forever until you hit Control-C.
Entering WAITING loop:  time.struct_time(tm_year=2014, tm_mon=6, tm_mday=20, tm_hour=9, tm_min=50, tm_sec=57, tm_wday=4, tm_yday=171, tm_isdst=1)
Heartbeat Packet size:  58
Heartbeat Packet size:  58
Heartbeat Packet size:  1024
Heartbeat Packet size:  1024
...................
Back To Top
Assuming you got the email messages that the Tracelog files are stale,
you have to determine why that is so.
acisway
In order to acheive commonality of code such that one set of code can
be used on all the different computers, several factors had to fall into
place:
All of the web page (and PMON) machines are Red Hat Linux virtual
machines. Acis60-v, acisway, ishmael and aciscdp-v are under total ACIS Ops
control.
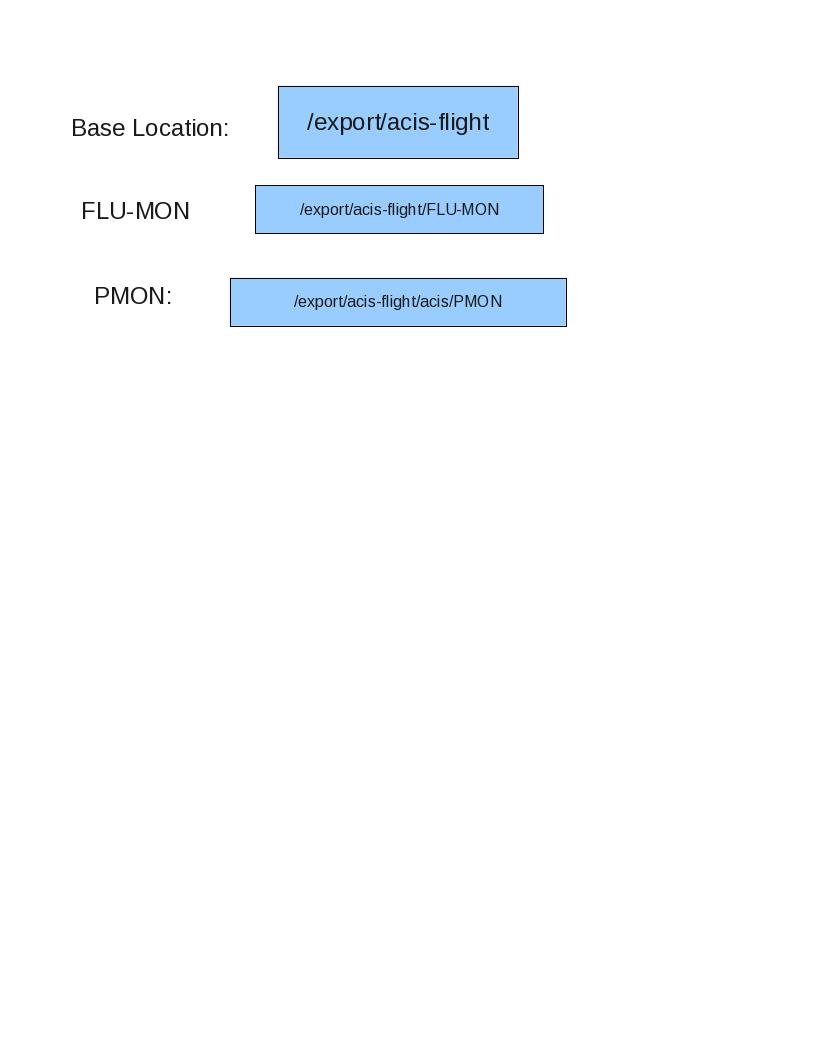
ACIS Ops was able to build a directory structure under /export/acis-flight to
contain all the R/T Web page (and PMON) programs and data.
One Perl script called GetUDP.pl is located in
/export/acis-flight/UTILITIES. The output of this program is:
After the switch to the GOT feeds (and the end of MultiMon) all
the web page machines could use the exact same UDP ports for ACORN.
Thus all the machines use 15000 for ACORN and 16000 for PMON. This
handy feature means that nothing need be adjusted by use to run on
the BUOCC.
One of the impacts of this isolation is that a new username/account
must be created which lives only on these four machines and nowhere
else. This is why we do not log on to these machines as "acisdude".
Were we to log on as "acisdude" a HEAD disk (which holds the acisdude
home directory) would then be mounted on the new virtual machines. Any other
process within HEAD that uses that disk could interfere with the ACIS
R/T web pages.
Consequently, a new account - "acisweb" - was created.
Last updated:
01/16/25
Stale Tracelogs and What if We Are NOT Getting Packets?.
First off, if anyone anywhere does anything with the network that
supports the telemetry data streams going to the R/T Web pages
and PMON, the data stream will become fouled and ACORN cannot handle
that. Therefore, you must always ask the GOT to reset the COG
telemetry streams. Send the GOT an email with content that looks like
this:
----------------------------
Hello GOT,
Would you please reset the telemetry streams on the following machines:
aciscdp-v
acis60-v
ishmael
All four use Port Numbers 15000 and 16000
---------------------------
The GOT understands what needs to be done but it is the job of the On Call
person to remind him.
Once the telemetry stream is reset, you should get data at the next
Comm and the tracelog files will be updated. If you feel like
checking the packet stream then you can do so by going here:
Are We Getting Packets?
If you don't get updating .tl files, then kill the acorn process. The
CRON jobs will restart acorn.
Commonality and GetUDP.pl.
NOTE: It is up to ACIS Ops to ask for periodic updates
to the acis[60,occ,cdp]-v machines. Systems will not do it
automatically.
As of now the last two directories are different between all
machines, but the same on each machine. In other words,
"cxc.cfa.harvard.edu/acis/RT-ACISCDP-V"
is both the URL directory for aciscdp-v and the base directory for
the plots for aciscdp-v. For acis60-v the two directories are:
"hea-www.cfa.harvard.edu/~acisweb/htdocs/acis/RT-ACIS60-V".
Identical Machines and their locations.
Same Directory
structure.
The Limit Table
Complexity.
Near the top of each Real Time Web page is a link called:
"Check the ACIS Limits Table"
Clicking on this link shows you the latest known limits for ACIS
MSID's.
Each machine contains the text, html and xls files on that machine's
web server, in that machine's URL base directory. For example, for
aciscdp-v, the URL base directory is:
/proj/web-cxc-dmz/htdocs/acis/RT-ACISCDP-V
and that directory contains:
limits.html is a soft link to limits_v1.17.html
header.html has the web server directory hard coded. So header.html
cannot presently be copied across each of the R/T web page machines.
All the limits_v1.17*'s are identical across all the R/T Web Page
machines
Port Selection.
All four use Port Numbers 15000 for acorn and 16000 is for PMON.
Directory Structure and Script Locations
OCC Backup Web Page Operations
aciscdp-v is our backup machine. Under normal operations all data
feeds come from the OCC. But under backup operations, that is not
the case. The change is transparent to aciscdp-v - you needn't do
anything! This magic is accomplished by the facts:
As usual, should the switch to BUOCC (Back Up OCC) occur, monitor the affect on
aciscdp-v.
Back To Top
Annoying CRON messages that occur from time to time.
From time to time, various CRON messages appear which, are annoying,
are usually out of your control and fairly inocuous.
Generally they occur because of system and/or network glitches.
If they occur once or twice or even three times but then stop,
then you can ignore them.
If they persist then perhaps you might have to look into things. It
could be that one of the machines has lost its network connection
Back To Top
Body of the email: ERROR: Cannot copy
- This one can be due to the fact that the acisdude area on
acisdude on r2d2-v is full. Do a df -k or quota -v to see if it
is. If you are maxed out, either free up some space or asks Systems for
more, or both.
Body of the email:
Couldn't get
http://www.swpc.noaa.gov/ftpdir/lists/ace/ace_epam_5m.txt at
/export/acis-flight/FLU-MON/ace-fluxLWP.pl line 53.
- This one is due to some issue at the server end. You will
find the other R/T web pages will be able to get to the web
page without any trouble.
- Also do not be misled because the
example above says "acis60-v"...it can happen on any of the
machines.
Body of the email: rm: cannot remove
`/export/acis-flight/acis/bin/PLOTTERS/ENGPLOTTER/CODE/LOGFILES/systemlog':
No such file or directory
Just ignore.
Reasons for the 2015 Virtual Machine Modifications
ACIS R/T web page operations can be
compromised by other processes running on the virtual machine which
have nothing to do with ACIS or the ACIS Real/Time (R/T) web pages.
This could be because of disk mounts and/or process hangs, for example. ACIS Ops
decided that three new virtual machines should be created, and that
these three machines should be as isolated from other HEAD operations
as is possible.
No Other operations will be executed on our 4
virtual or real machines other than the R/T web pages and a PMON
instantiation.
.
Back To Top
Limits Checking and Limit File Modifications
The web page HTMl that you see when you look at an R/T web page is
created by a program called:
acis-www.pl.
It's located in:
/export/acis-flight/acis/bin
Data to insert in the displays are obtained from Tracelog files
produced by ACORN. These values are compared to limits specified for
each MSID to determine if they are Nominal, in the Yellow Low/High
range, or the Red Low/High range. The entries on the web page are
color coded: white for Nominal; Red for Red ranges and yellow for
yellow ranges.
In the past, the limit values were hard coded into acis-www.pl. As
these limits are also used by other programs, a limits data file was
created. Now acis-www.pl reads the limits for the MSIDs out of this
file and uses those values to make the comparisons. The data file
exists on all 4 machines. So when yuo edit one you have to sftp a copy
to the others in the same location.
The files affected are:
/export/acis-flight/acis/bin
--------------------------------
acis-www.pl
AlertStatus.pl
/export/acis-flight/UTILITIES
-----------------------------------
ReadLimitsFile.pl
The limits file itself is located at:
-------------------------------------
/export/acis-flight/acis/bin/PLOTTERS/ENGPLOTTER/CODE/engplot_limits
Back To Top