II. Rolling Monthly
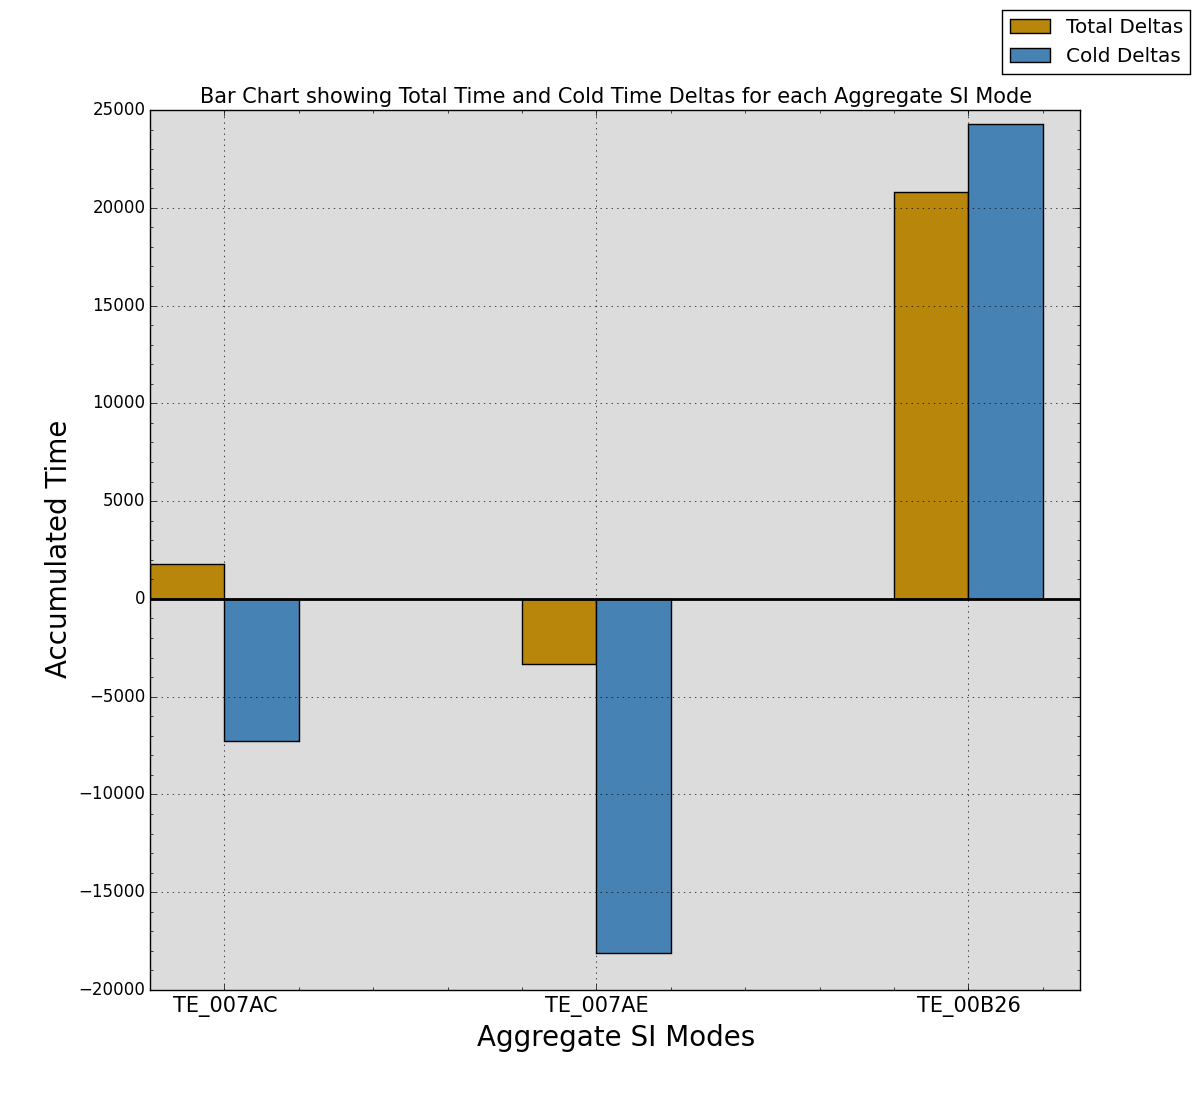
The present targets for the Total and Cold times are:
Total time per SI Mode per measurement: 7600.0 seconds
Fraction of total time the measurement should be cold: 60.0%
Back To Top
| Stats | TE_007AC | TE_007AE | TE_00B26 |
|---|---|---|---|
| Total Expected Time (secs) | 53200 | 38000 | 68400 |
| Total Actual Time (secs) | 54992 | 34695 | 89196 |
| Delta From Expected (secs) | 1792.00 | -3305.00 | 20796.23 |
| % of Expected Total (secs) | 103.37% | 91.30% | 130.40% |
| Stats | TE_007AC | TE_007AE | TE_00B26 |
|---|---|---|---|
| Total Exp. Cold Time (secs) | 31920.0 | 22800.0 | 41040.0 |
| Total Actual Cold Time (secs) | 24662 | 4693 | 65319 |
| Delta From Expected (secs) | -7257.99 | -18106.52 | 24279.41 |
| % of Exp. Cold Total (secs) | 77.26% | 20.59% | 159.16% |

| SI Mode | Total Number of Obs. | Total Exposure Time (sec) | Average Exposure (sec/obs) | |
|---|---|---|---|---|
| Primary 6 Chip SI Modes | TE_007AC | 7 | 54992.00 | 7856.00 |
| TE_007AE | 4 | 28602.00 | 7150.50 | |
| TE_00B26 | 7 | 46774.00 | 6682.00 | Old 6 Chip SI Modes | TE_00216 | 0 | 0.00 | 0.00 |
| TE_0021C | 0 | 0.00 | 0.00 | |
| TE_008EA | 0 | 0.00 | 0.00 | 5 Chip SI Modes | TE_00C60 | 1 | 7532.00 | 7532.00 |
| TE_00CA8 | 1 | 6093.00 | 6093.00 | 4 Chip SI Modes | TE_00C62 | 1 | 34890.23 | 34890.23 |
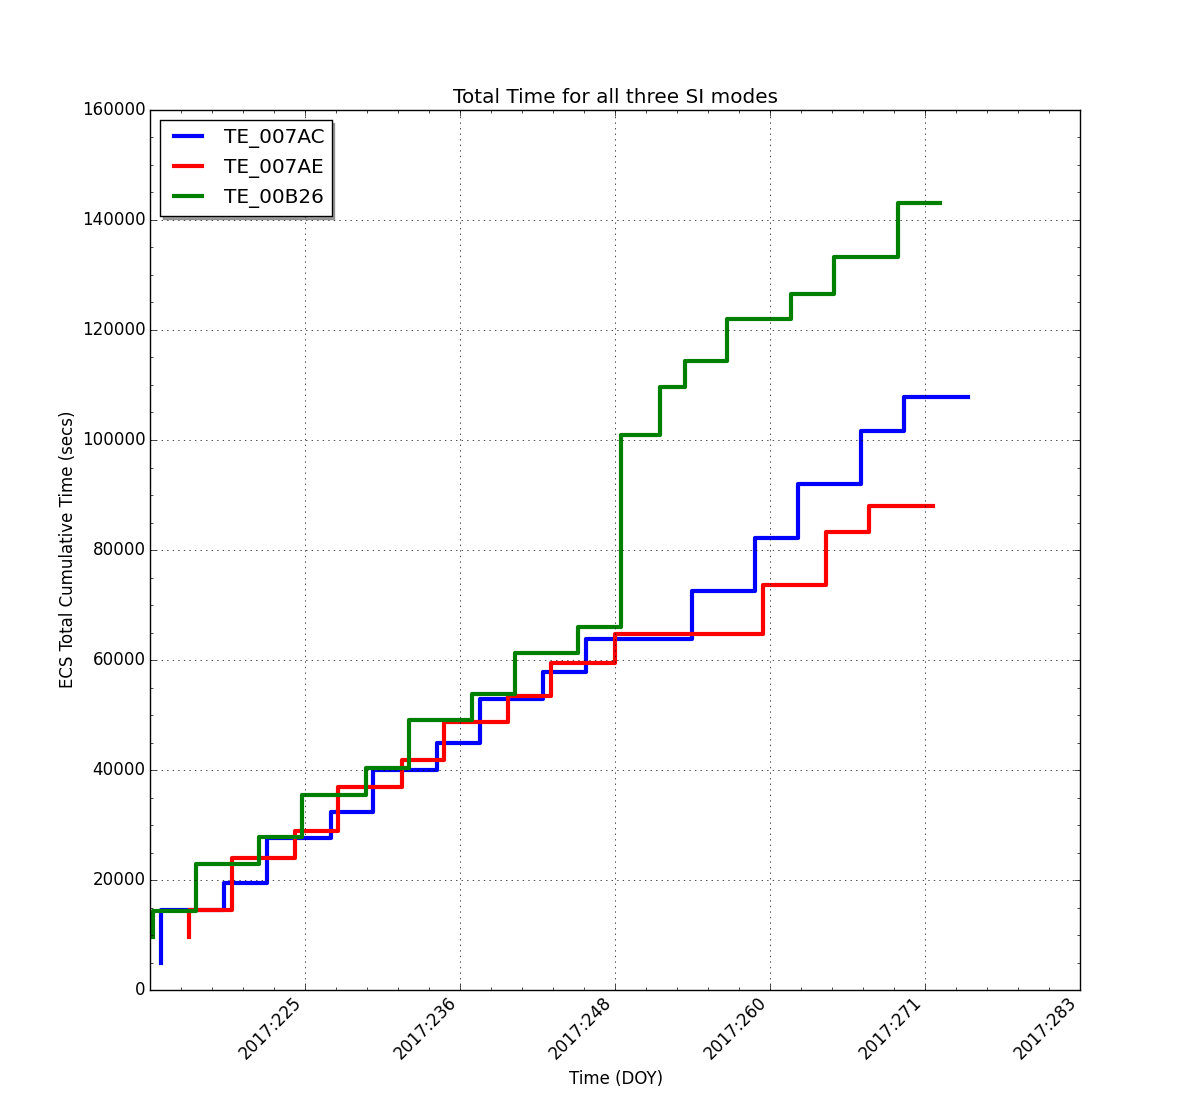
III. Statistics Since the Start of the Current Epoch
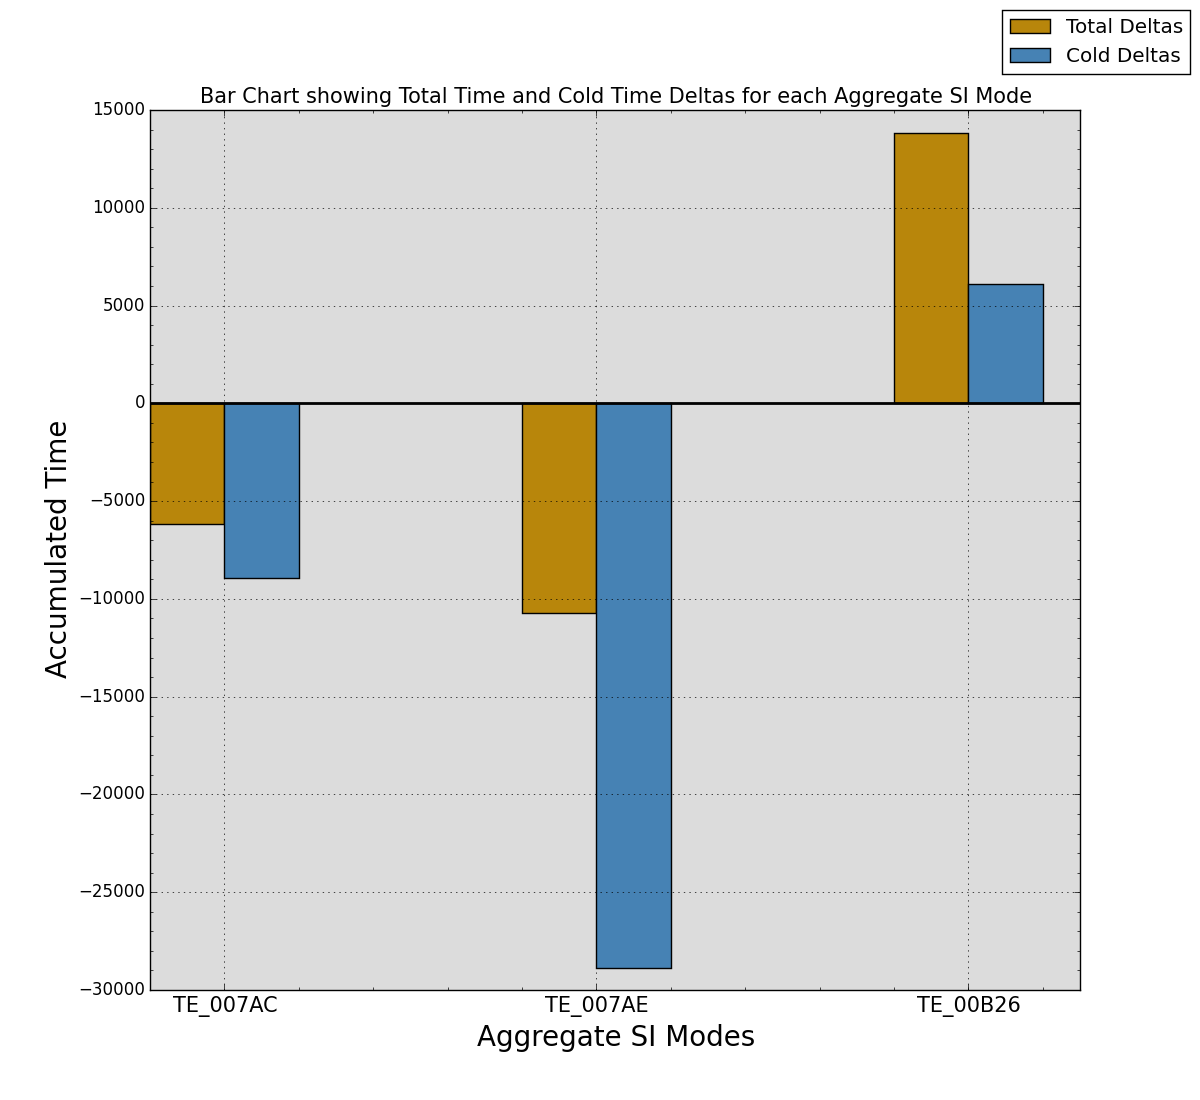
| Stats | TE_007AC | TE_007AE | TE_00B26 |
|---|---|---|---|
| Total Expected Time (secs) | 114000 | 98800 | 129200 |
| Total Actual Time (secs) | 107823 | 88067 | 143011 |
| Delta From Expected (secs) | -6177.00 | -10733.00 | 13811.23 |
| % of Expected Total (secs) | 94.58% | 89.14% | 110.69% |
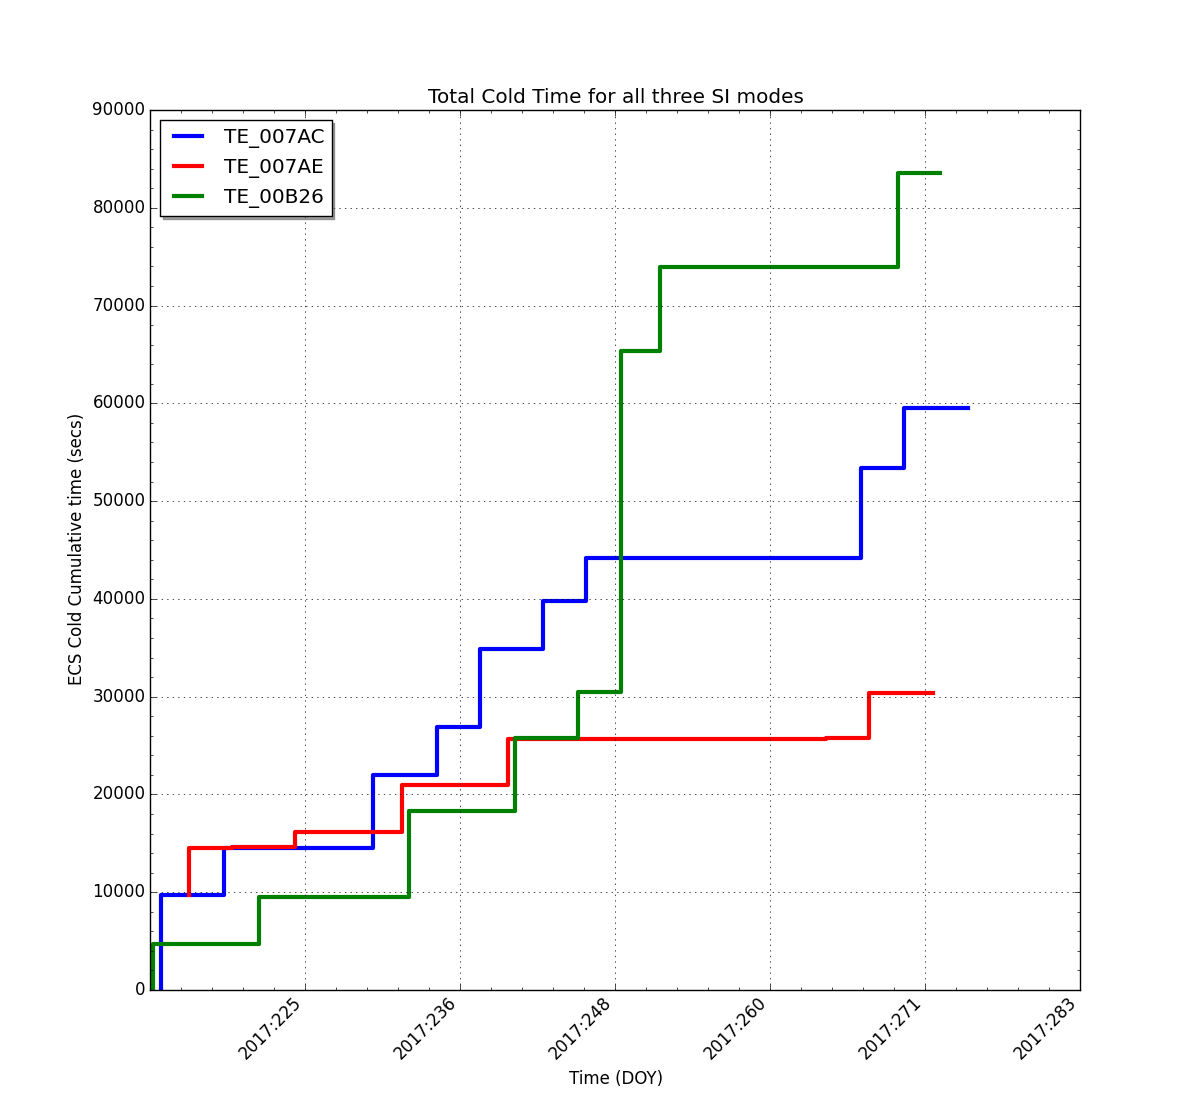
| Stats | TE_007AC | TE_007AE | TE_00B26 |
|---|---|---|---|
| Total Exp. Cold Time (secs) | 68400.0 | 59280.0 | 77520.0 |
| Total Actual Cold Time (secs) | 59487 | 30400 | 83602 |
| Delta From Expected (secs) | -8912.58 | -28879.01 | 6082.59 |
| % of Exp. Cold Total (secs) | 86.97% | 51.28% | 107.85% |
| SI Mode | Total Number of Obs. | Total Exposure Time (sec) | Average Exposure (sec/obs) | |
|---|---|---|---|---|
| Primary 6 Chip SI Modes | TE_007AC | 15 | 107823.00 | 7188.20 |
| TE_007AE | 12 | 81974.00 | 6831.17 | |
| TE_00B26 | 15 | 100589.00 | 6705.93 | Old 6 Chip SI Modes | TE_00216 | 0 | 0.00 | 0.00 |
| TE_0021C | 0 | 0.00 | 0.00 | |
| TE_008EA | 0 | 0.00 | 0.00 | 5 Chip SI Modes | TE_00C60 | 1 | 7532.00 | 7532.00 |
| TE_00CA8 | 1 | 6093.00 | 6093.00 | 4 Chip SI Modes | TE_00C62 | 1 | 34890.23 | 34890.23 |
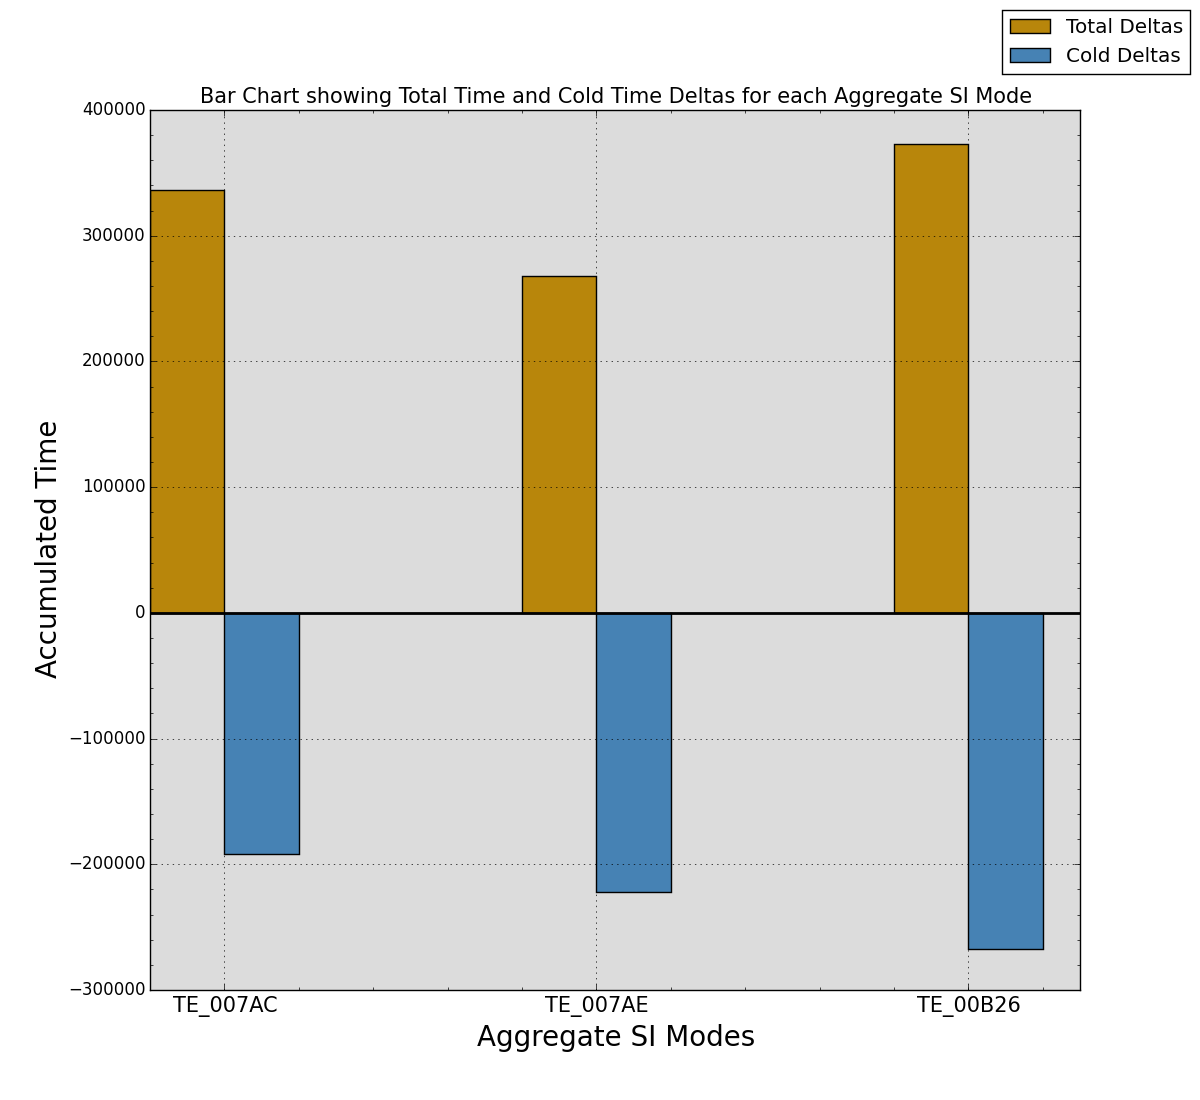
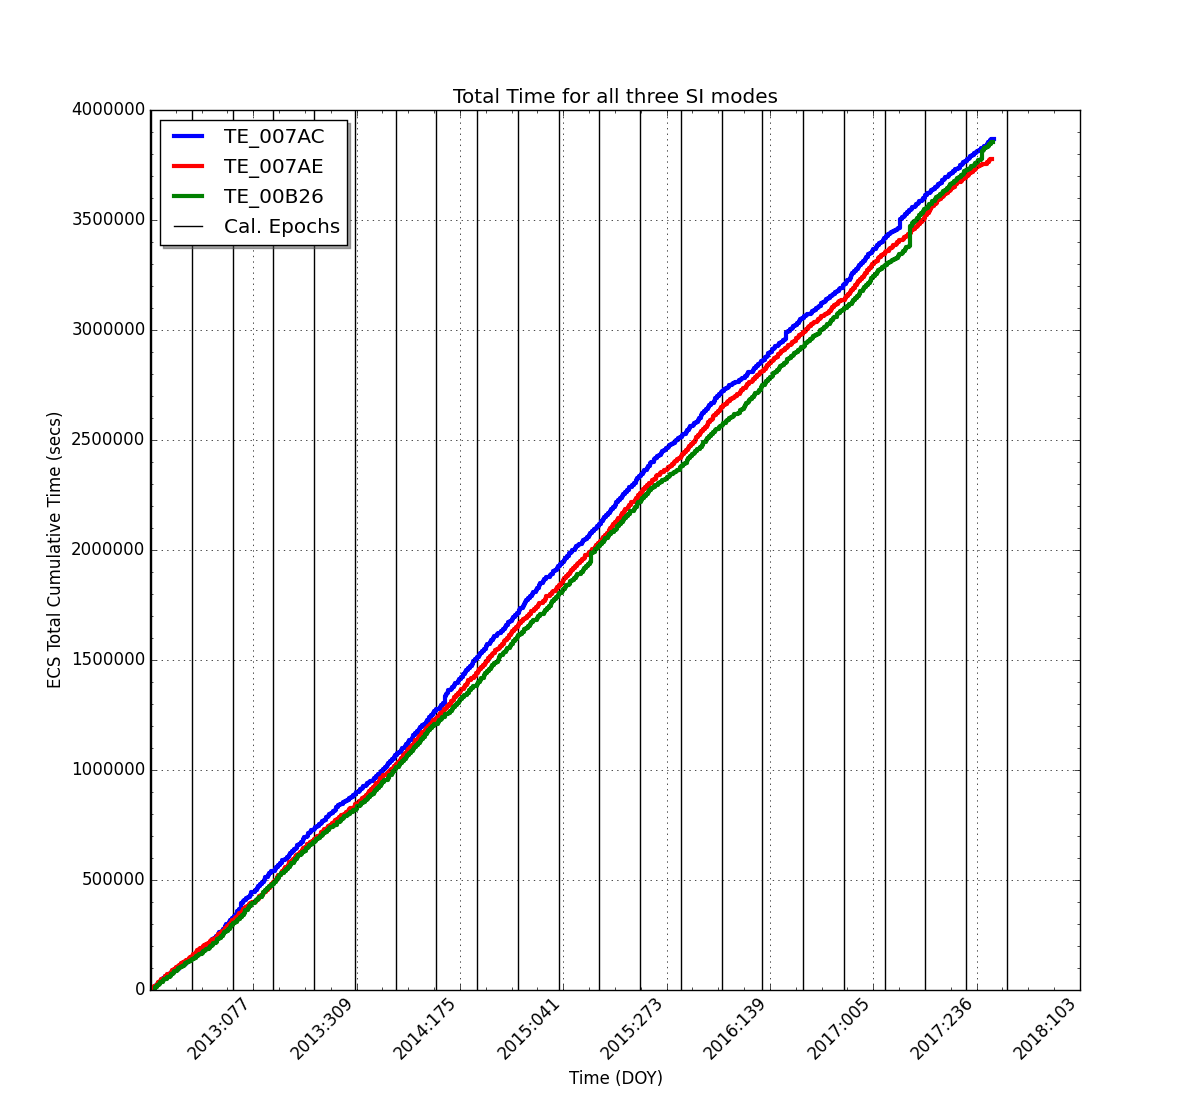
| Stats | TE_007AC | TE_007AE | TE_00B26 |
|---|---|---|---|
| Total Expected Time (secs) | 3534000 | 3511200 | 3480800 |
| Total Actual Time (secs) | 3870352 | 3779251 | 3853788 |
| Delta From Expected (secs) | 336352.52 | 268051.04 | 372988.65 |
| % of Expected Total (secs) | 109.52% | 107.63% | 110.72% |
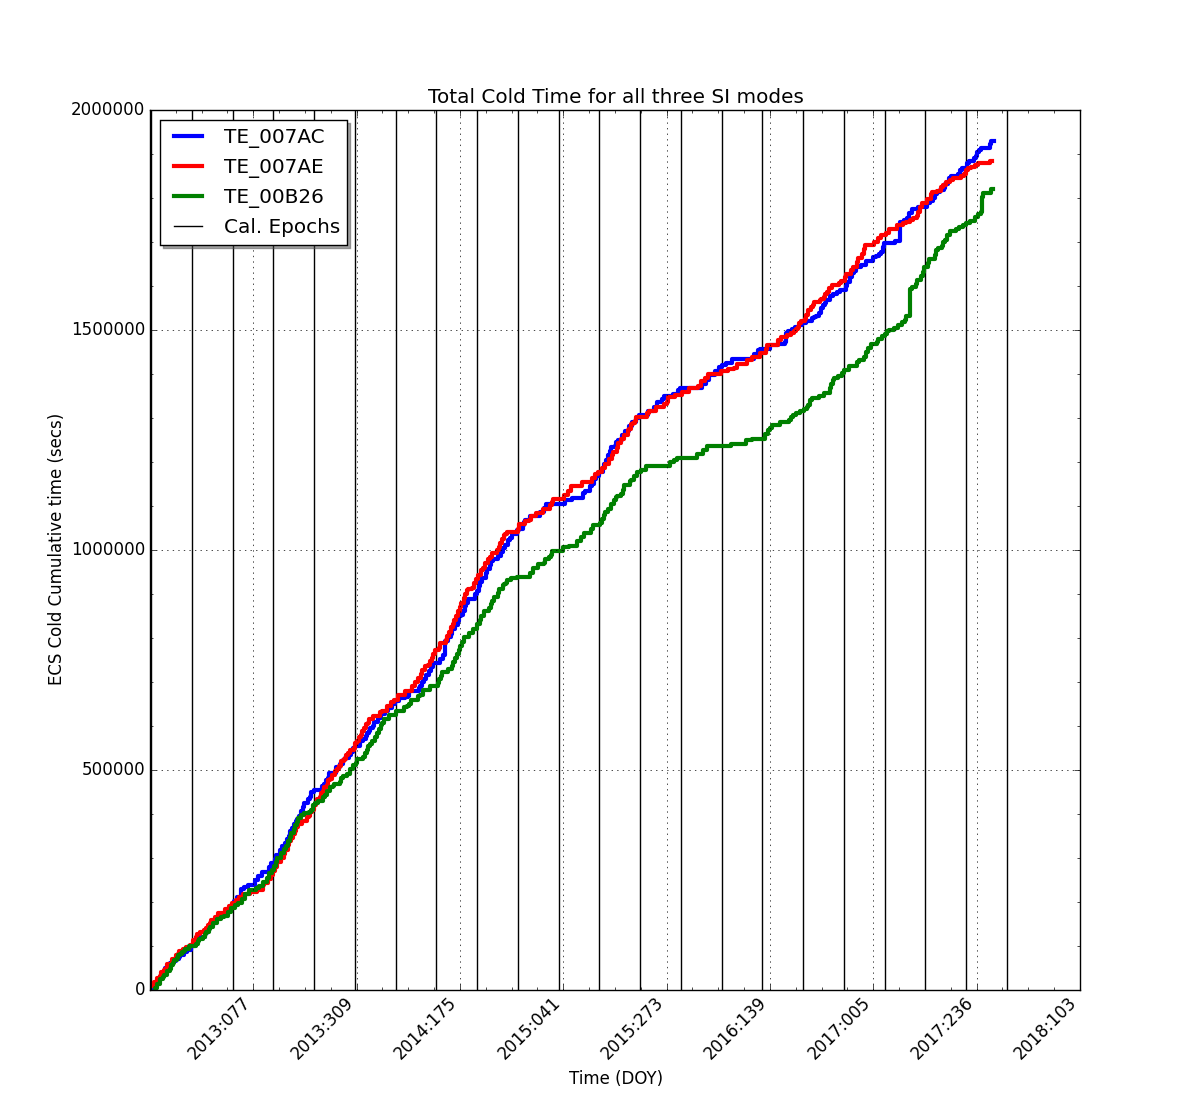
| Stats | TE_007AC | TE_007AE | TE_00B26 |
|---|---|---|---|
| Total Exp. Cold Time (secs) | 2120400.0 | 2106720.0 | 2088480.0 |
| Total Actual Cold Time (secs) | 1928413 | 1884992 | 1821480 |
| Delta From Expected (secs) | -191986.42 | -221727.73 | -266999.29 |
| % of Exp. Cold Total (secs) | 90.95% | 89.48% | 87.22% |
| SI Mode | Total Number of Obs. | Total Exposure Time (sec) | Average Exposure (sec/obs) | |
|---|---|---|---|---|
| Primary 6 Chip SI Modes | TE_007AC | 463 | 3817075.52 | 8244.22 |
| TE_007AE | 460 | 3763441.04 | 8181.39 | |
| TE_00B26 | 454 | 3715606.93 | 8184.16 | Old 6 Chip SI Modes | TE_00216 | 5 | 478338.25 | 95667.65 |
| TE_0021C | 0 | 0.00 | 0.00 | |
| TE_008EA | 0 | 0.00 | 0.00 | 5 Chip SI Modes | TE_00C60 | 3 | 23932.00 | 7977.33 |
| TE_00CA8 | 2 | 15810.00 | 7905.00 | 4 Chip SI Modes | TE_00C62 | 3 | 167526.73 | 55842.24 |