II. Rolling Monthly
The present targets for the Total and Cold times are:
Total time per SI Mode per measurement: 7600.0 seconds
Fraction of total time the measurement should be cold: 60.0%
Back To Top
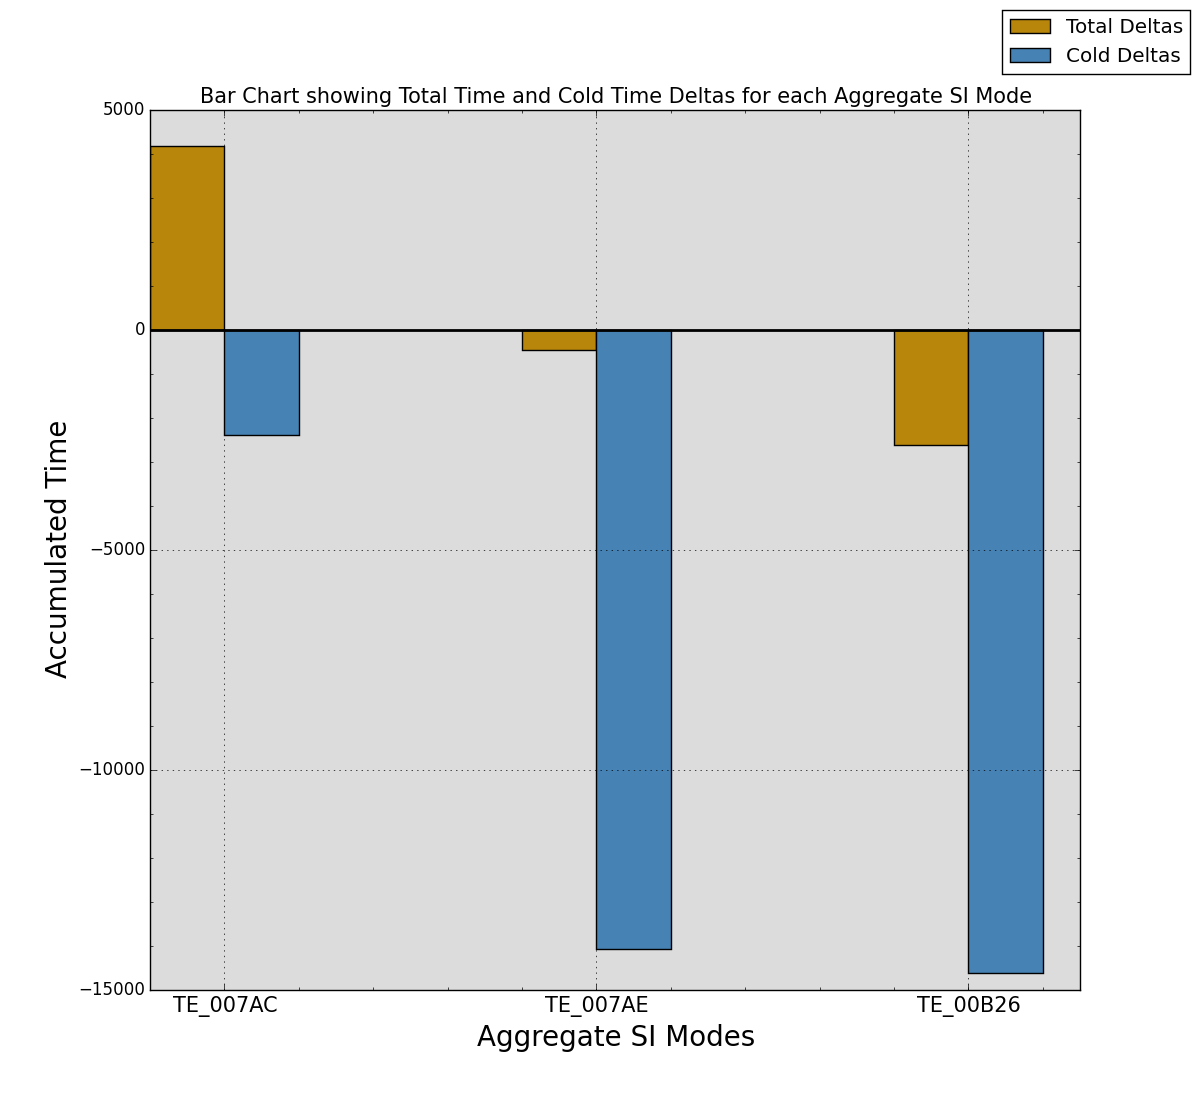
| Stats | TE_007AC | TE_007AE | TE_00B26 |
|---|---|---|---|
| Total Expected Time (secs) | 45600 | 53200 | 76000 |
| Total Actual Time (secs) | 49772 | 52753 | 73391 |
| Delta From Expected (secs) | 4172.00 | -447.00 | -2609.00 |
| % of Expected Total (secs) | 109.15% | 99.16% | 96.57% |
| Stats | TE_007AC | TE_007AE | TE_00B26 |
|---|---|---|---|
| Total Exp. Cold Time (secs) | 27360.0 | 31920.0 | 45600.0 |
| Total Actual Cold Time (secs) | 24969 | 17862 | 30979 |
| Delta From Expected (secs) | -2390.23 | -14057.07 | -14620.65 |
| % of Exp. Cold Total (secs) | 91.26% | 55.96% | 67.94% |
| SI Mode | Total Number of Obs. | Total Exposure Time (sec) | Average Exposure (sec/obs) | |
|---|---|---|---|---|
| Primary 6 Chip SI Modes | TE_007AC | 6 | 49772.00 | 8295.33 |
| TE_007AE | 7 | 52753.00 | 7536.14 | |
| TE_00B26 | 10 | 73391.00 | 7339.10 | Old 6 Chip SI Modes | TE_00216 | 0 | 0.00 | 0.00 |
| TE_0021C | 0 | 0.00 | 0.00 | |
| TE_008EA | 0 | 0.00 | 0.00 | 5 Chip SI Modes | TE_00C60 | 0 | 0.00 | 0.00 |
| TE_00CA8 | 0 | 0.00 | 0.00 | 4 Chip SI Modes | TE_00C62 | 0 | 0.00 | 0.00 |
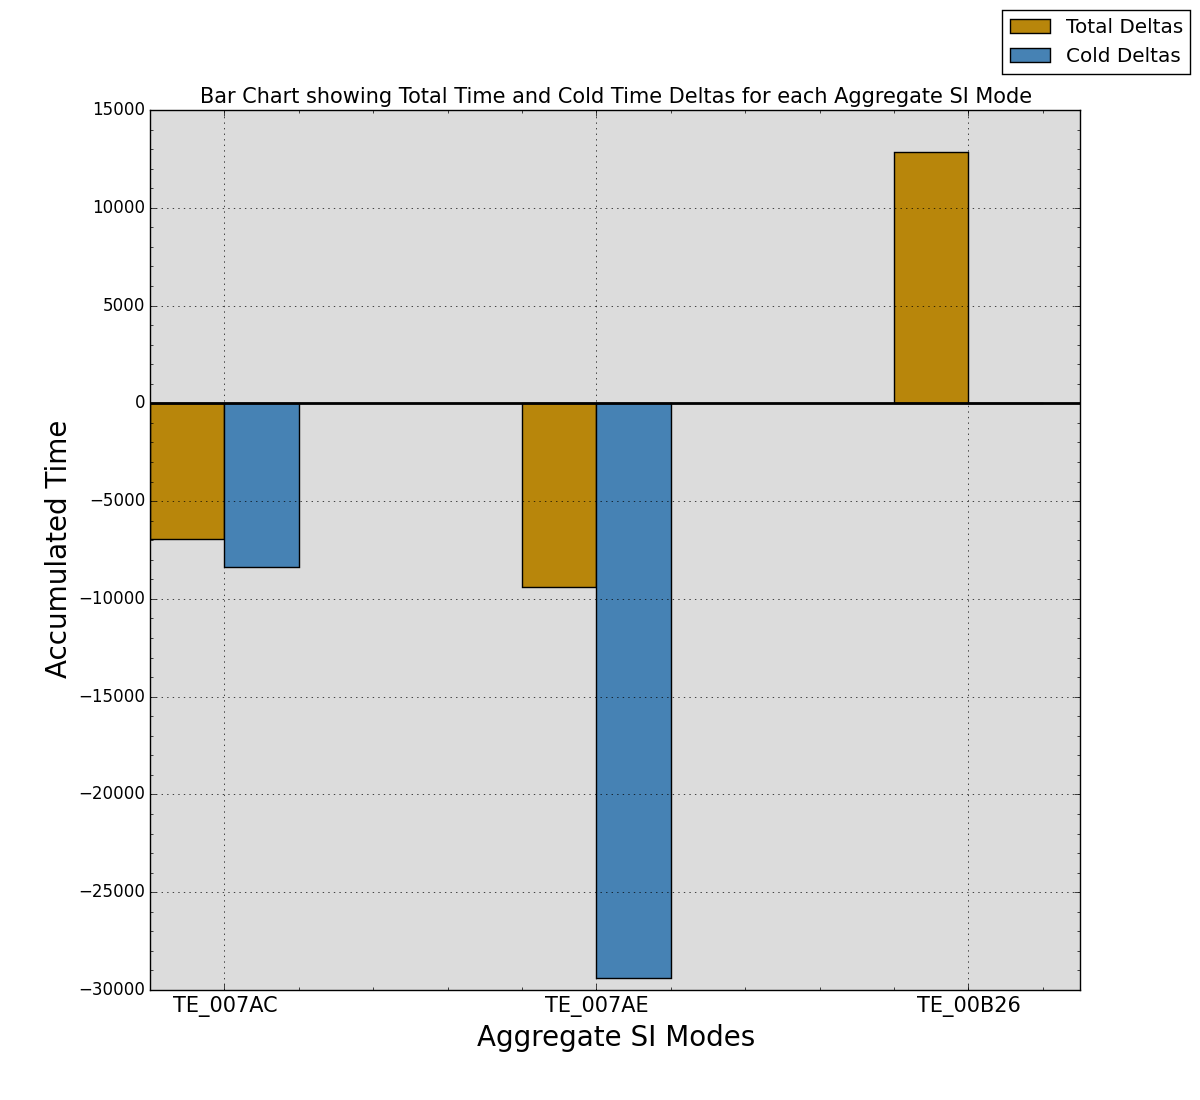
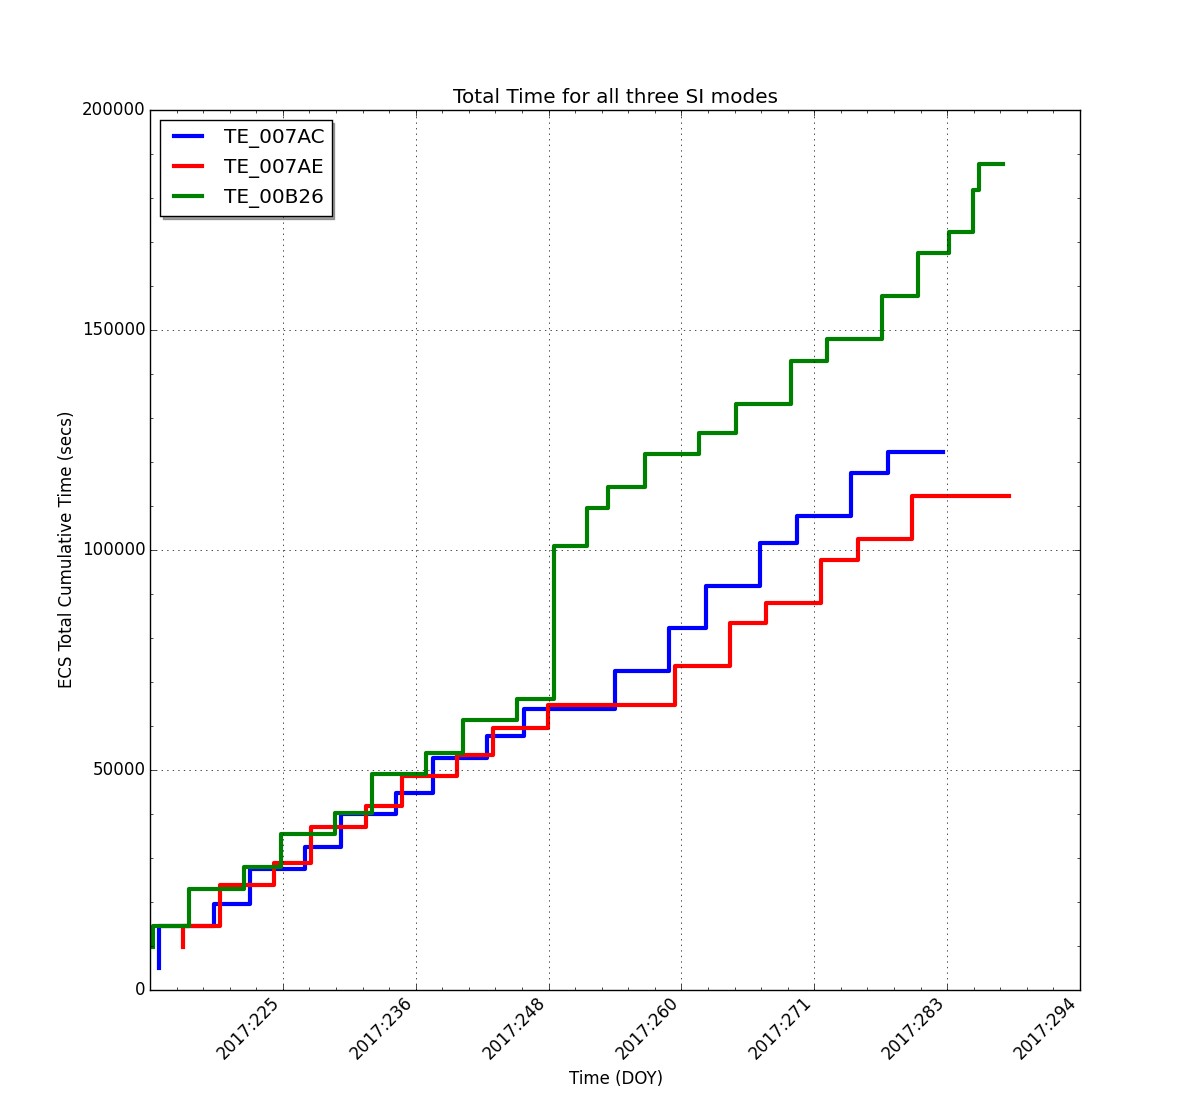
III. Statistics Since the Start of the Current Epoch
| Stats | TE_007AC | TE_007AE | TE_00B26 |
|---|---|---|---|
| Total Expected Time (secs) | 129200 | 121600 | 174800 |
| Total Actual Time (secs) | 122257 | 112218 | 187674 |
| Delta From Expected (secs) | -6943.00 | -9382.00 | 12874.23 |
| % of Expected Total (secs) | 94.63% | 92.28% | 107.37% |
| Stats | TE_007AC | TE_007AE | TE_00B26 |
|---|---|---|---|
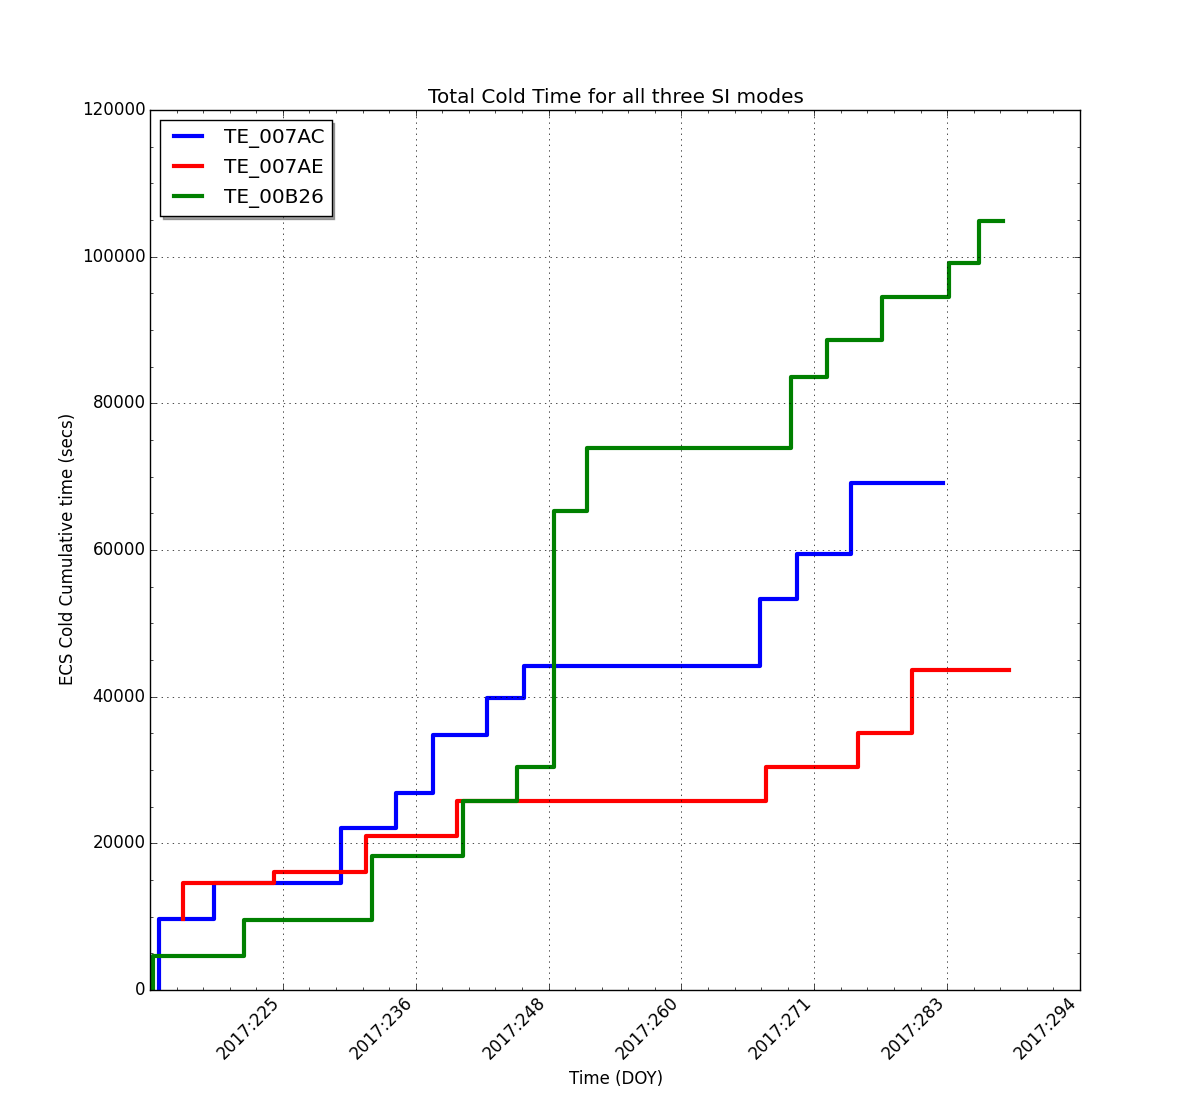
| Total Exp. Cold Time (secs) | 77520.0 | 72960.0 | 104880.0 |
| Total Actual Cold Time (secs) | 69164 | 43570 | 104904 |
| Delta From Expected (secs) | -8355.56 | -29389.55 | 24.40 |
| % of Exp. Cold Total (secs) | 89.22% | 59.72% | 100.02% |
| SI Mode | Total Number of Obs. | Total Exposure Time (sec) | Average Exposure (sec/obs) | |
|---|---|---|---|---|
| Primary 6 Chip SI Modes | TE_007AC | 17 | 122257.00 | 7191.59 |
| TE_007AE | 15 | 106125.00 | 7075.00 | |
| TE_00B26 | 21 | 145252.00 | 6916.76 | Old 6 Chip SI Modes | TE_00216 | 0 | 0.00 | 0.00 |
| TE_0021C | 0 | 0.00 | 0.00 | |
| TE_008EA | 0 | 0.00 | 0.00 | 5 Chip SI Modes | TE_00C60 | 1 | 7532.00 | 7532.00 |
| TE_00CA8 | 1 | 6093.00 | 6093.00 | 4 Chip SI Modes | TE_00C62 | 1 | 34890.23 | 34890.23 |
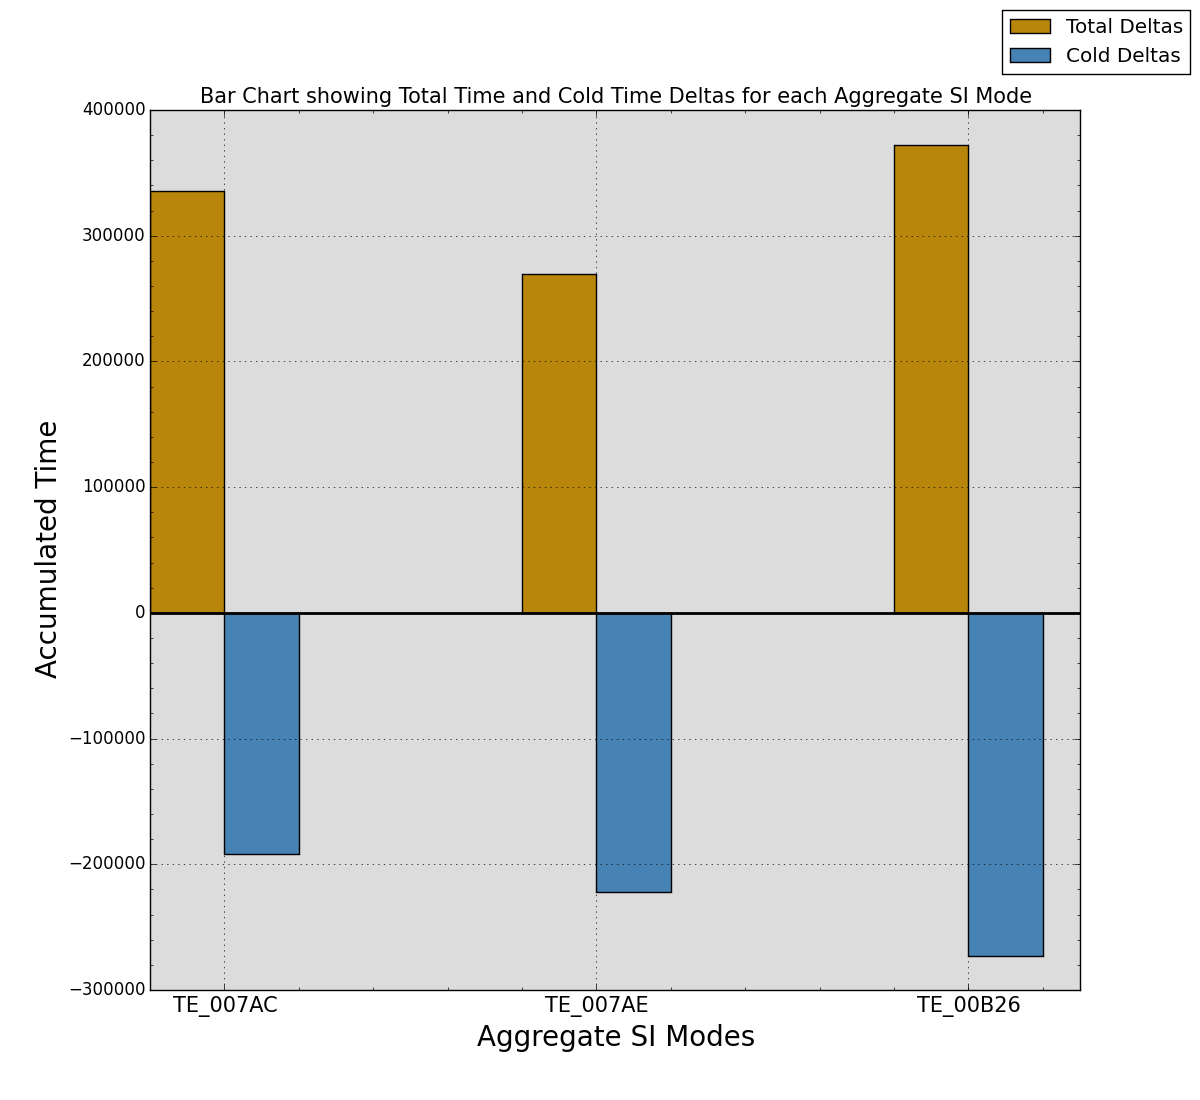
| Stats | TE_007AC | TE_007AE | TE_00B26 |
|---|---|---|---|
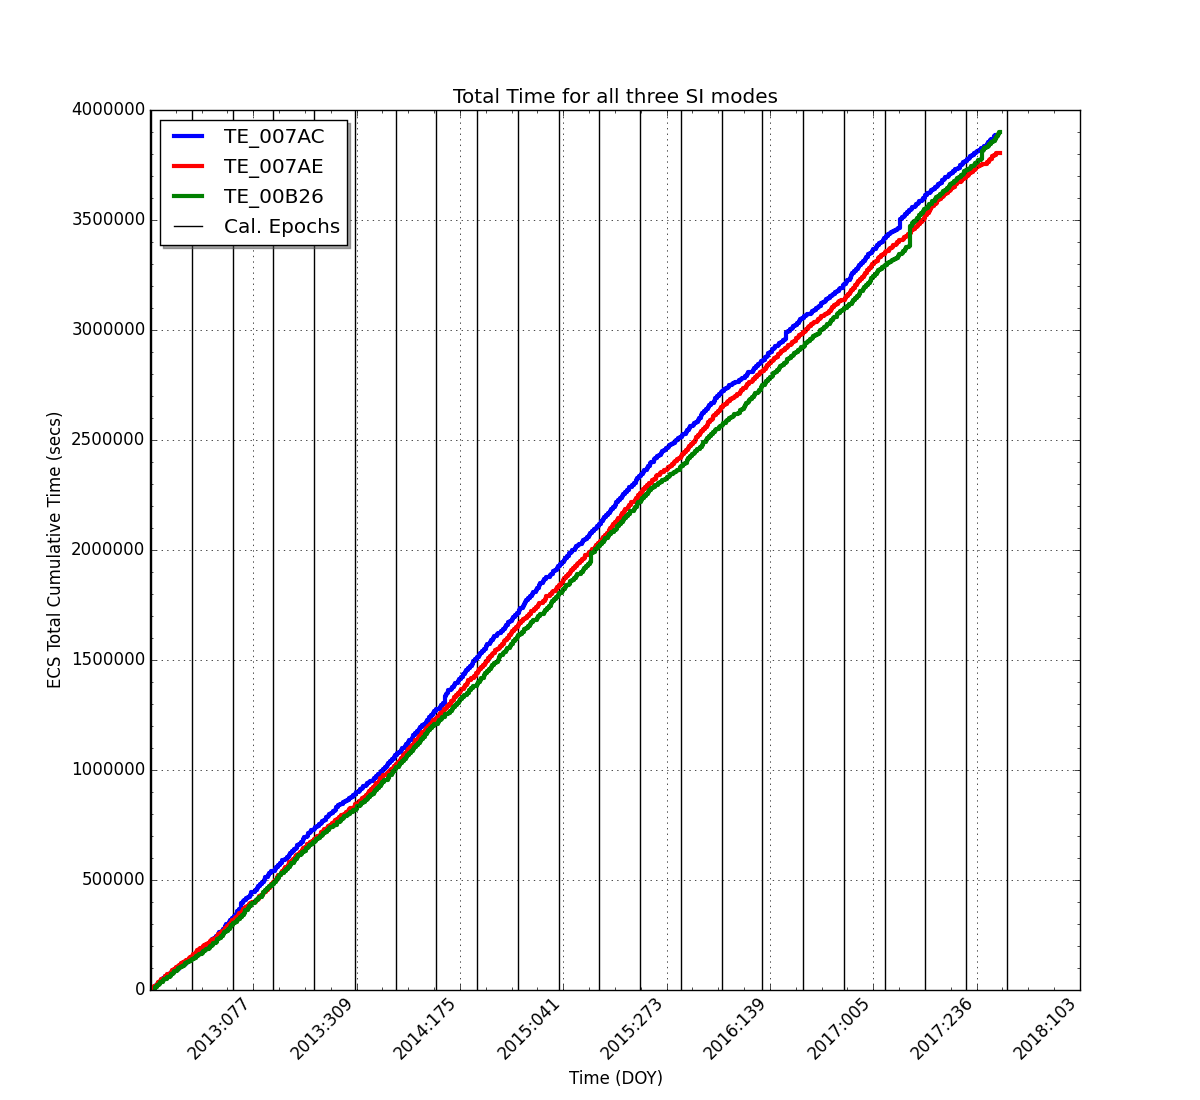
| Total Expected Time (secs) | 3549200 | 3534000 | 3526400 |
| Total Actual Time (secs) | 3884786 | 3803402 | 3898451 |
| Delta From Expected (secs) | 335586.52 | 269402.04 | 372051.65 |
| % of Expected Total (secs) | 109.46% | 107.62% | 110.55% |
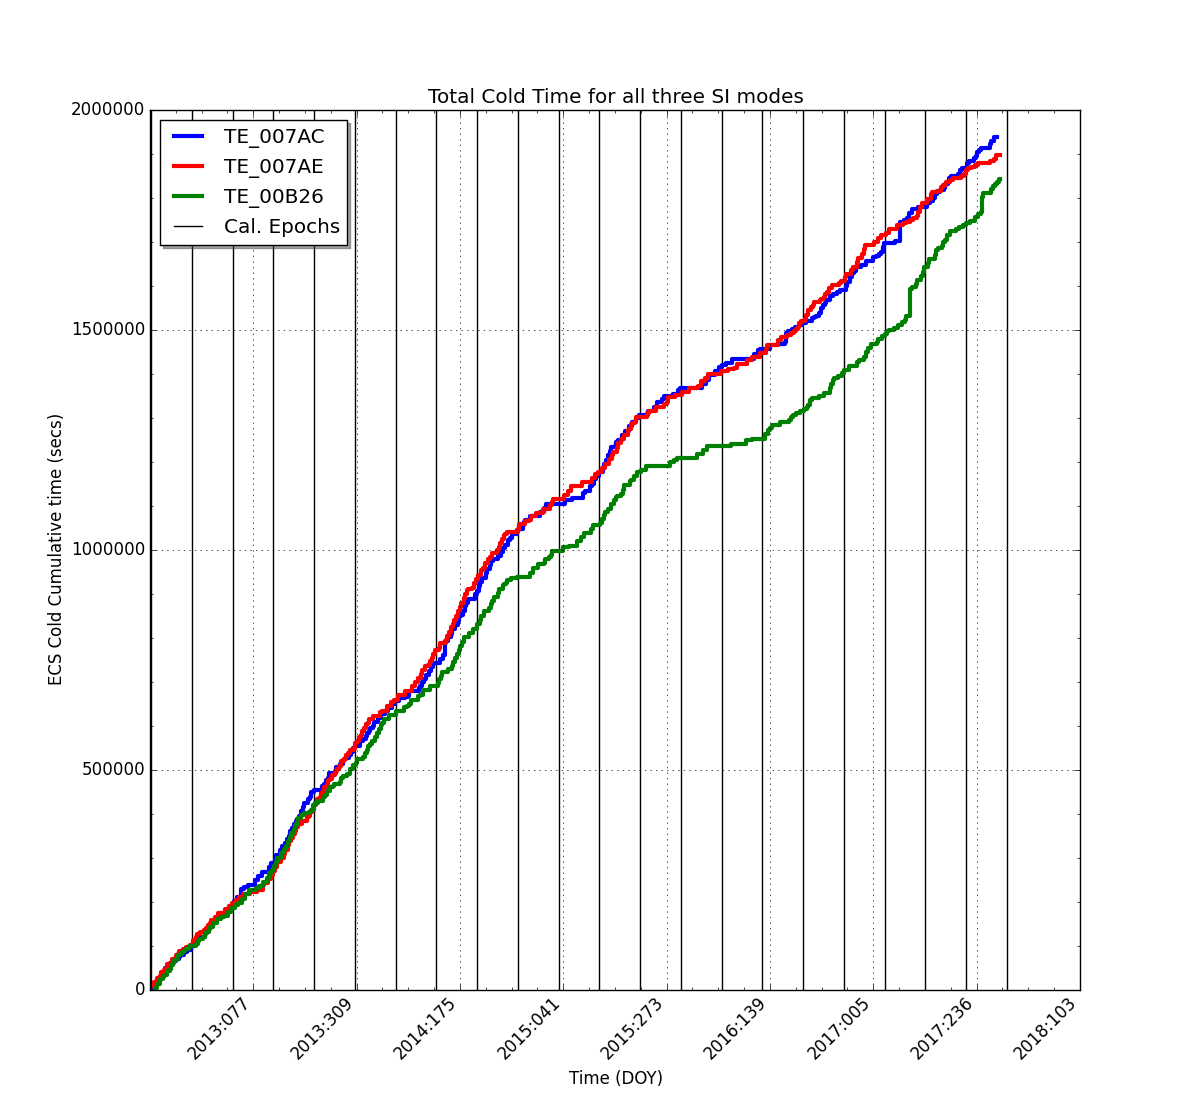
| Stats | TE_007AC | TE_007AE | TE_00B26 |
|---|---|---|---|
| Total Exp. Cold Time (secs) | 2129520.0 | 2120400.0 | 2115840.0 |
| Total Actual Cold Time (secs) | 1938090 | 1898161 | 1842782 |
| Delta From Expected (secs) | -191429.39 | -222238.27 | -273057.48 |
| % of Exp. Cold Total (secs) | 91.01% | 89.52% | 87.09% |
| SI Mode | Total Number of Obs. | Total Exposure Time (sec) | Average Exposure (sec/obs) | |
|---|---|---|---|---|
| Primary 6 Chip SI Modes | TE_007AC | 465 | 3831509.52 | 8239.81 |
| TE_007AE | 463 | 3787592.04 | 8180.54 | |
| TE_00B26 | 460 | 3760269.93 | 8174.50 | Old 6 Chip SI Modes | TE_00216 | 5 | 478338.25 | 95667.65 |
| TE_0021C | 0 | 0.00 | 0.00 | |
| TE_008EA | 0 | 0.00 | 0.00 | 5 Chip SI Modes | TE_00C60 | 3 | 23932.00 | 7977.33 |
| TE_00CA8 | 2 | 15810.00 | 7905.00 | 4 Chip SI Modes | TE_00C62 | 3 | 167526.73 | 55842.24 |
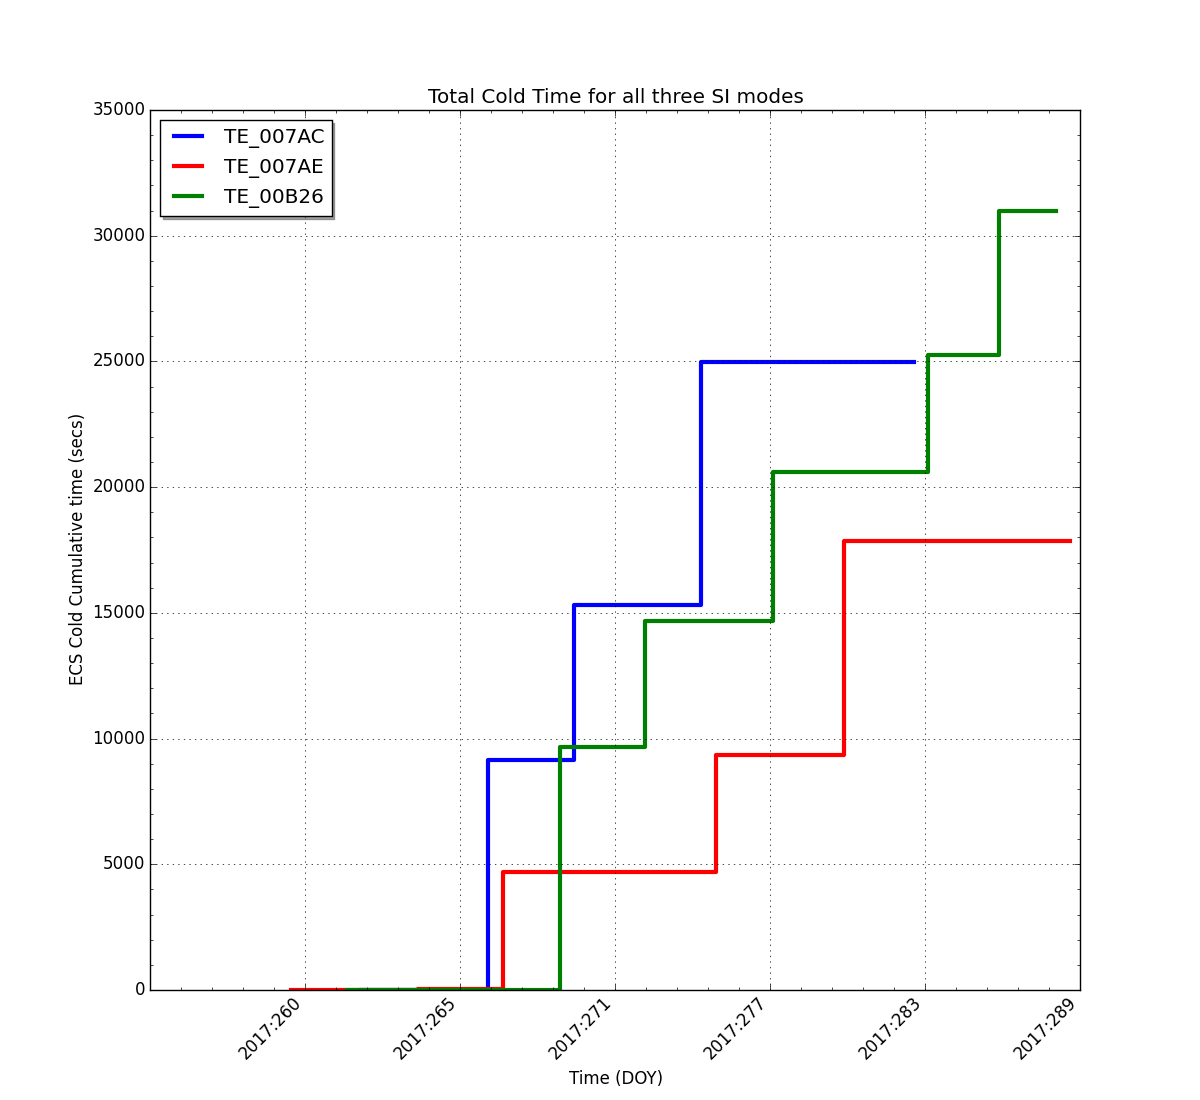
A word about the COLD Time stats:
- The Total Expected Cold Time value in the table below is 60.0% of the Total Expected Time (see Table above).
- Total Actual Cold Time is the sum of all time during each measurement where the temperature was <= -118.7 degrees C
- % of Expected Total is the fraction of the Total Expected Time achieved
SI Mode Mapping between 6,5 and 4 chip modes:
The 6 chip SI Modes consist of three distinct modes. But there are only 2, 5 chip SI Modes and only one 4 chip SI mode. To make tracking feasible, the 4 and 5 chip modes were mapped into the 6 chip modes in the following manner:
6 chip 5 chip 4 chip
TE_007AC -> TE_00C60 TE_00C62
TE_00B26 -> TE_00C60 TE_00C62
TE_007AE -> TE_00CA8
All of the TE_00CA8s get counted as TE_007AE
Half of the TE_00C60s get counted towards TE_007AC and the other half get counted with the TE_00B26s
Half of the TE_00C62s get counted towards TE_007AC and the other half get counted with the TE_00B26s.
So watchout for TE_00B26 over-representation.
Back To Top