II. Rolling Monthly
The present targets for the Total and Cold times are:
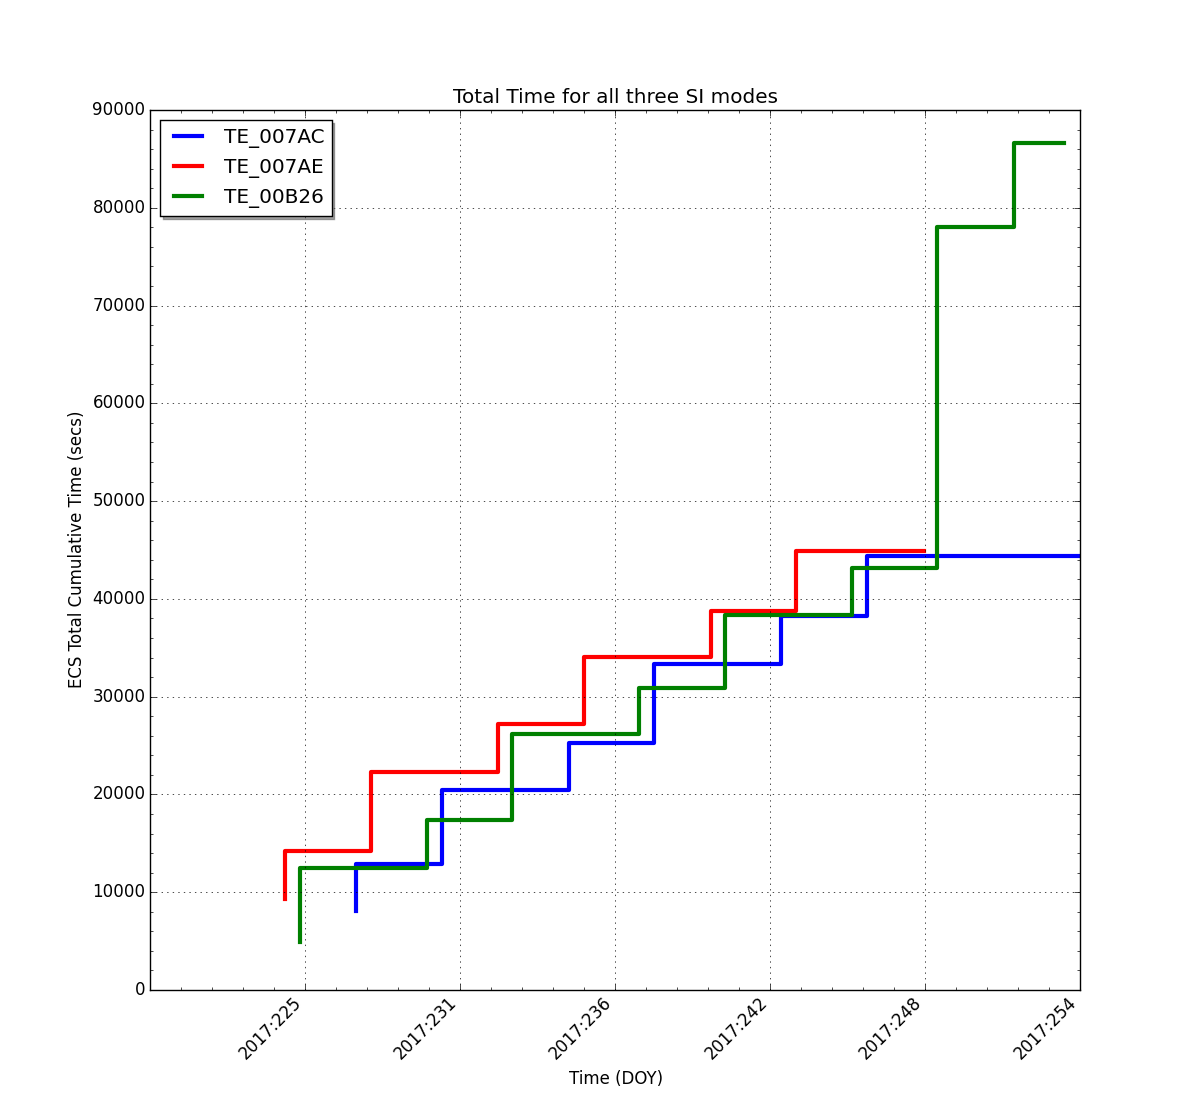
Total time per SI Mode per measurement: 7600.0 seconds
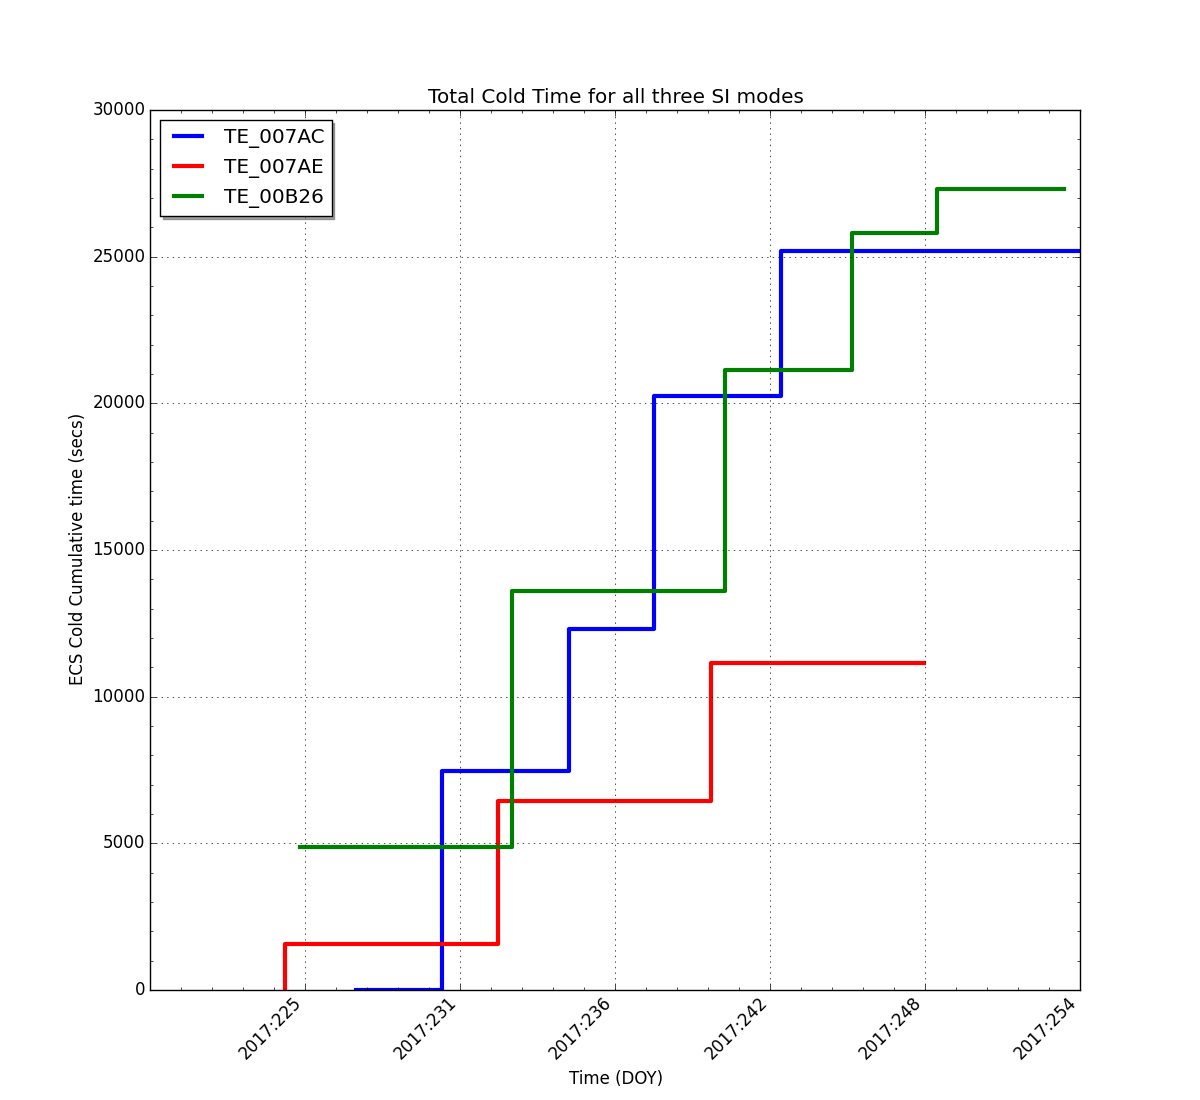
Fraction of total time the measurement should be cold: 60.0%
Back To Top
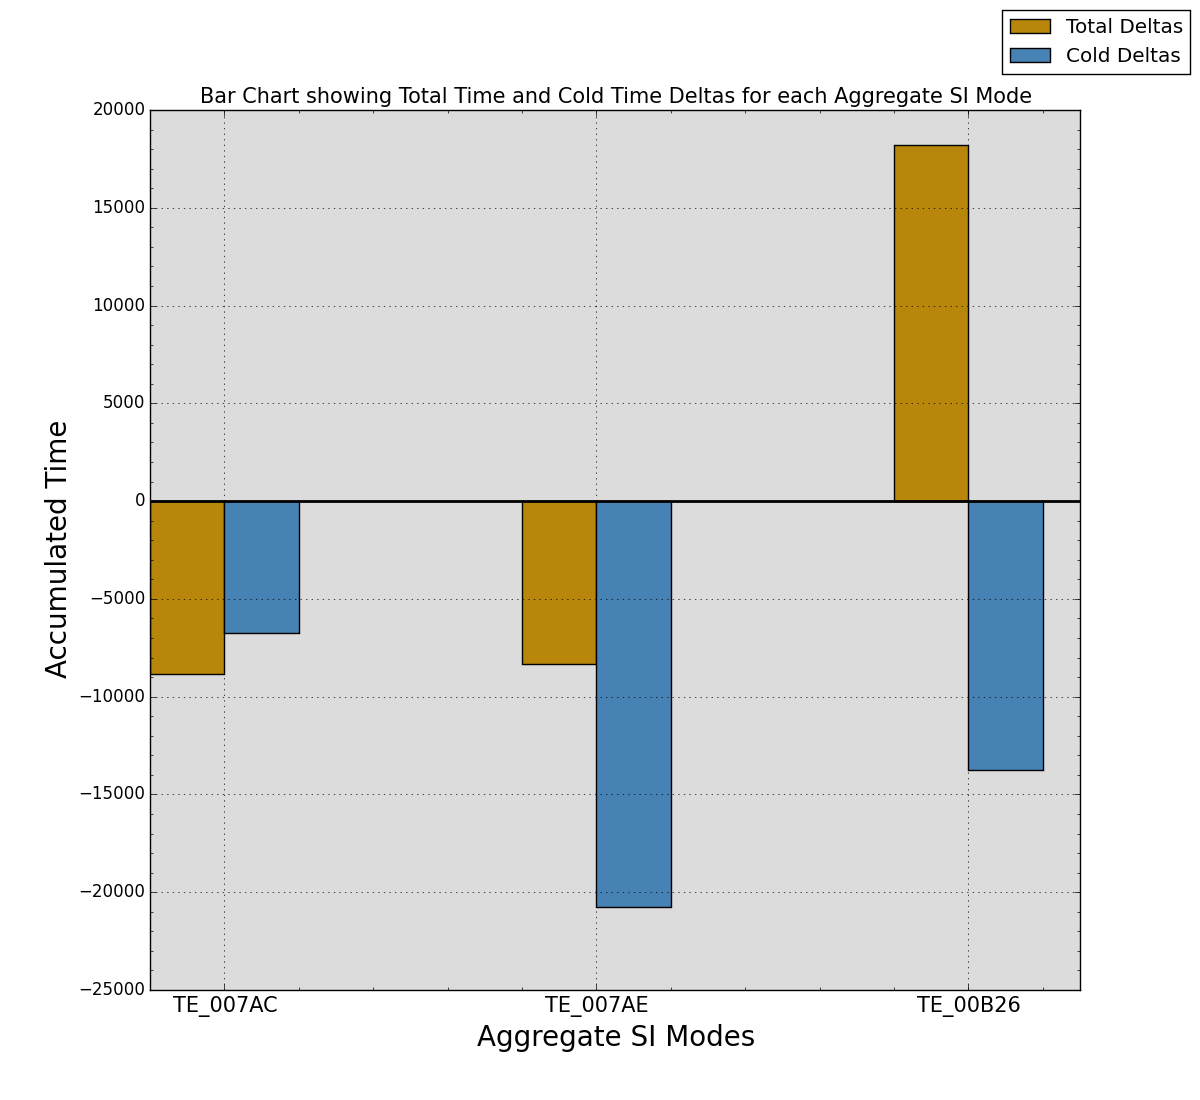
| Stats | TE_007AC | TE_007AE | TE_00B26 |
|---|---|---|---|
| Total Expected Time (secs) | 53200 | 53200 | 68400 |
| Total Actual Time (secs) | 44362 | 44851 | 86616 |
| Delta From Expected (secs) | -8838.00 | -8349.00 | 18216.23 |
| % of Expected Total (secs) | 83.39% | 84.31% | 126.63% |
| Stats | TE_007AC | TE_007AE | TE_00B26 |
|---|---|---|---|
| Total Exp. Cold Time (secs) | 31920.0 | 31920.0 | 41040.0 |
| Total Actual Cold Time (secs) | 25190 | 11157 | 27298 |
| Delta From Expected (secs) | -6729.09 | -20762.11 | -13741.17 |
| % of Exp. Cold Total (secs) | 78.92% | 34.96% | 66.52% |
| SI Mode | Total Number of Obs. | Total Exposure Time (sec) | Average Exposure (sec/obs) | |
|---|---|---|---|---|
| Primary 6 Chip SI Modes | TE_007AC | 7 | 44362.00 | 6337.43 |
| TE_007AE | 6 | 38758.00 | 6459.67 | |
| TE_00B26 | 7 | 44194.00 | 6313.43 | Old 6 Chip SI Modes | TE_00216 | 0 | 0.00 | 0.00 |
| TE_0021C | 0 | 0.00 | 0.00 | |
| TE_008EA | 0 | 0.00 | 0.00 | 5 Chip SI Modes | TE_00C60 | 1 | 7532.00 | 7532.00 |
| TE_00CA8 | 1 | 6093.00 | 6093.00 | 4 Chip SI Modes | TE_00C62 | 1 | 34890.23 | 34890.23 |
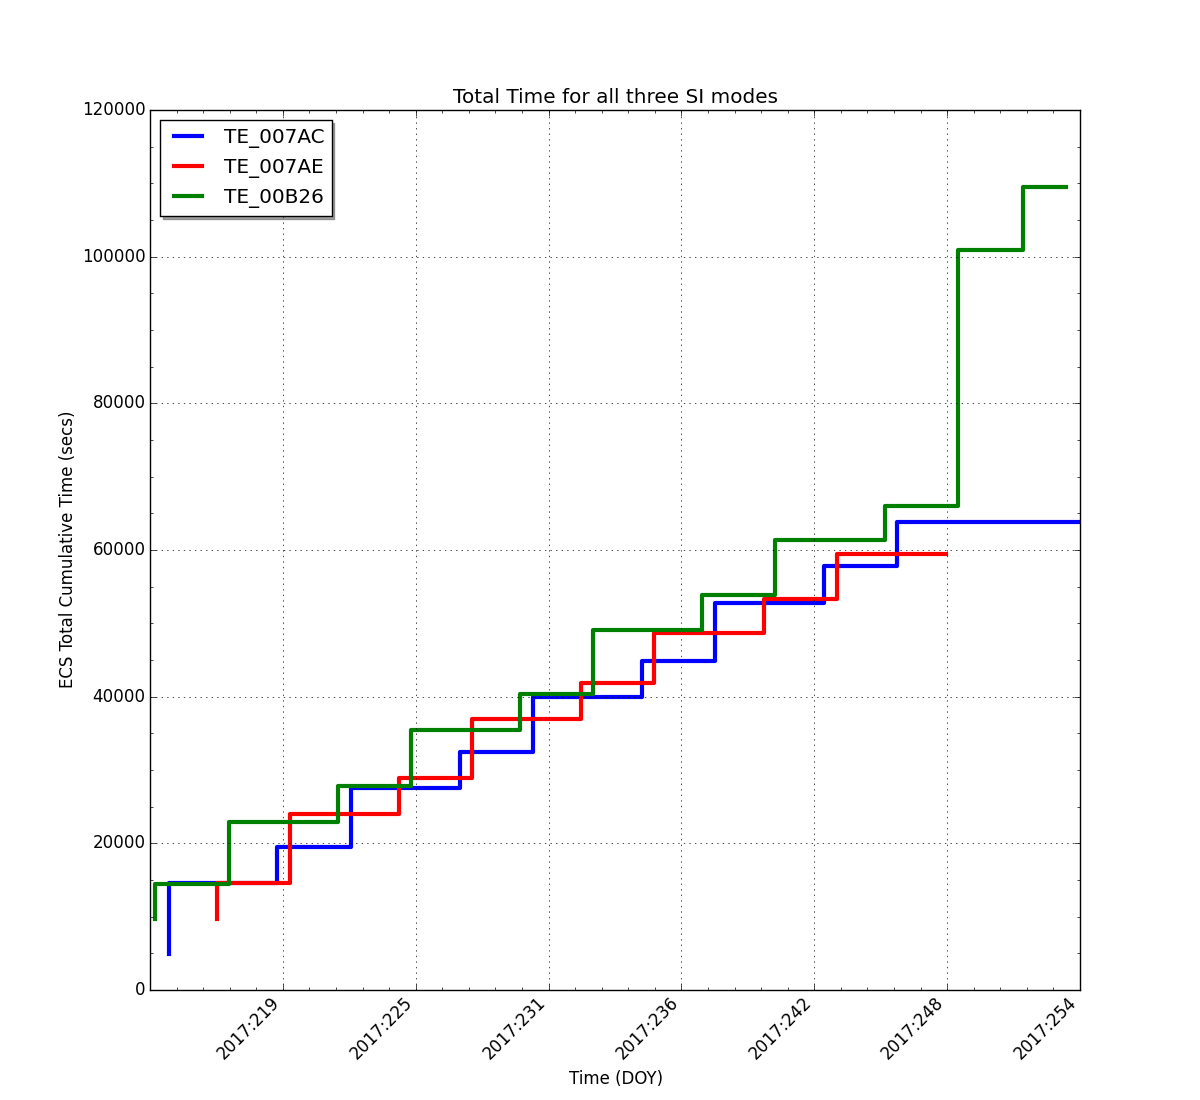
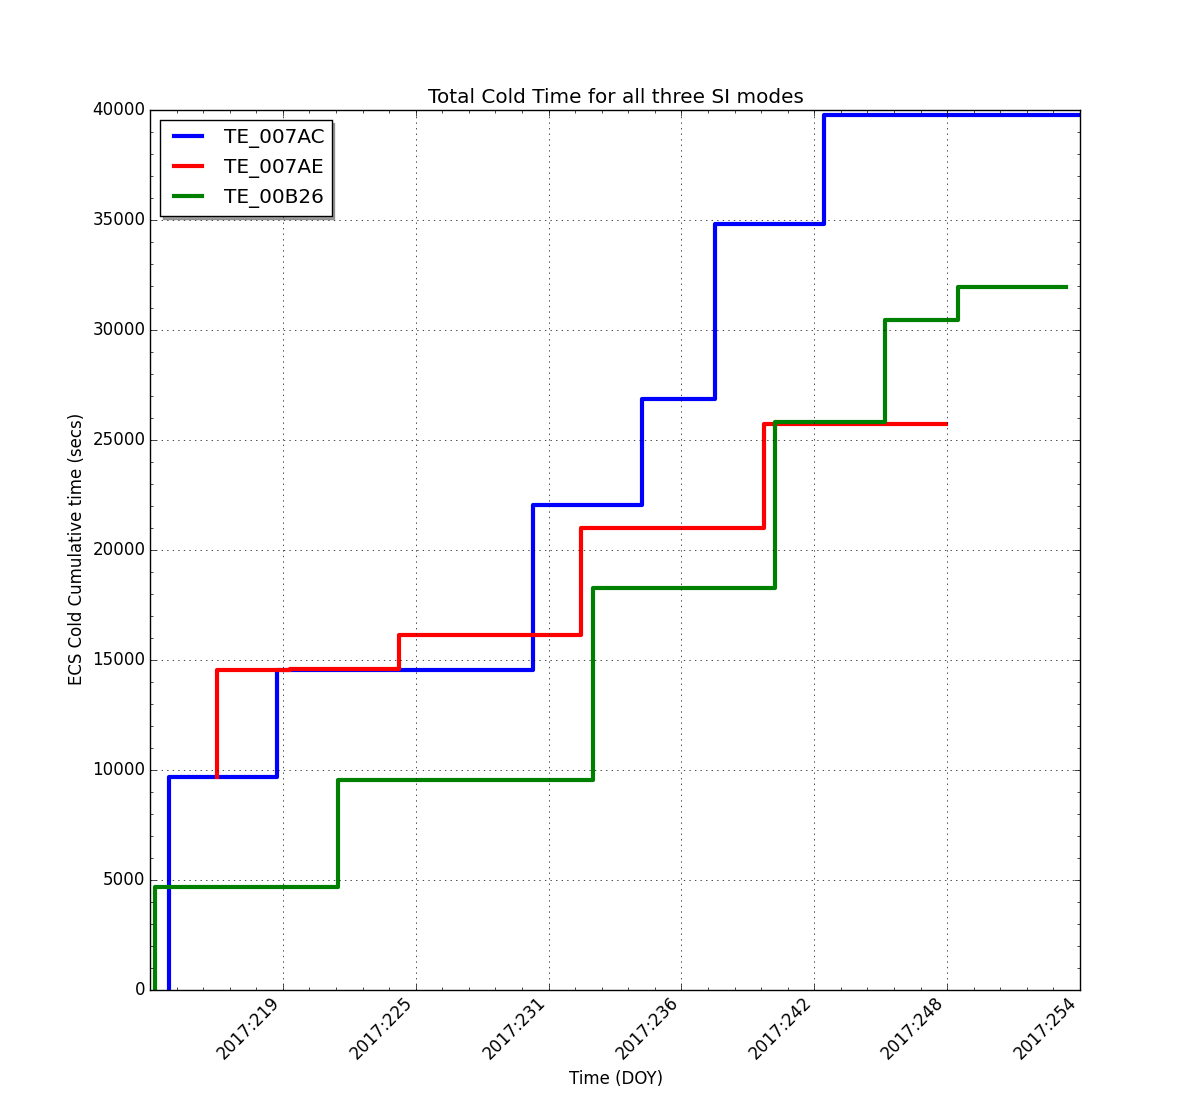
III. Statistics Since the Start of the Current Epoch
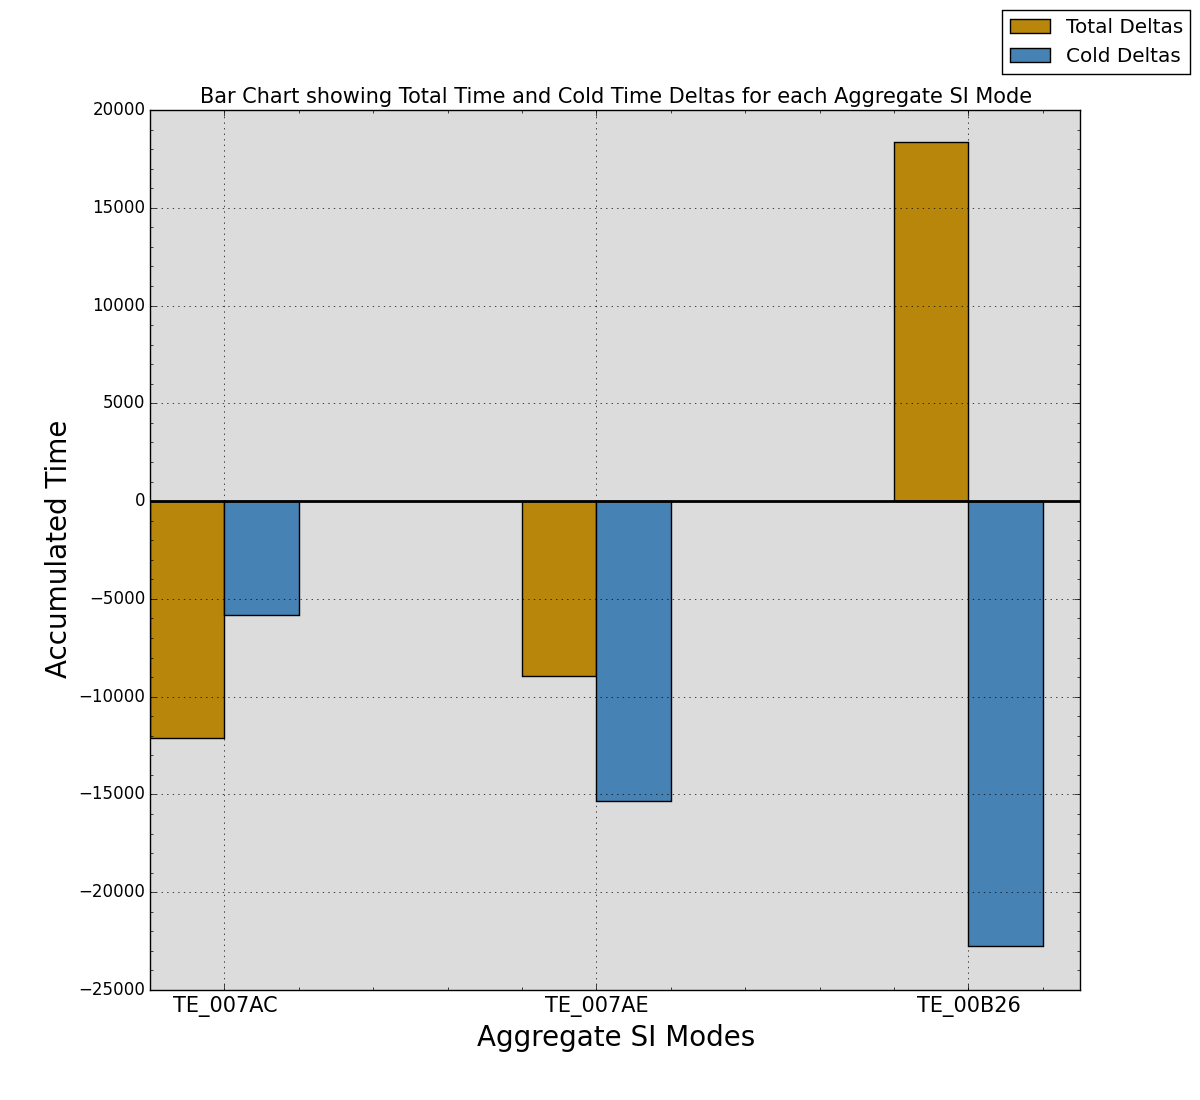
| Stats | TE_007AC | TE_007AE | TE_00B26 |
|---|---|---|---|
| Total Expected Time (secs) | 76000 | 68400 | 91200 |
| Total Actual Time (secs) | 63873 | 59465 | 109566 |
| Delta From Expected (secs) | -12127.00 | -8935.00 | 18366.23 |
| % of Expected Total (secs) | 84.04% | 86.94% | 120.14% |
| Stats | TE_007AC | TE_007AE | TE_00B26 |
|---|---|---|---|
| Total Exp. Cold Time (secs) | 45600.0 | 41040.0 | 54720.0 |
| Total Actual Cold Time (secs) | 39756 | 25707 | 31964 |
| Delta From Expected (secs) | -5843.58 | -15332.49 | -22755.89 |
| % of Exp. Cold Total (secs) | 87.19% | 62.64% | 58.41% |
| SI Mode | Total Number of Obs. | Total Exposure Time (sec) | Average Exposure (sec/obs) | |
|---|---|---|---|---|
| Primary 6 Chip SI Modes | TE_007AC | 10 | 63873.00 | 6387.30 |
| TE_007AE | 8 | 53372.00 | 6671.50 | |
| TE_00B26 | 10 | 67144.00 | 6714.40 | Old 6 Chip SI Modes | TE_00216 | 0 | 0.00 | 0.00 |
| TE_0021C | 0 | 0.00 | 0.00 | |
| TE_008EA | 0 | 0.00 | 0.00 | 5 Chip SI Modes | TE_00C60 | 1 | 7532.00 | 7532.00 |
| TE_00CA8 | 1 | 6093.00 | 6093.00 | 4 Chip SI Modes | TE_00C62 | 1 | 34890.23 | 34890.23 |
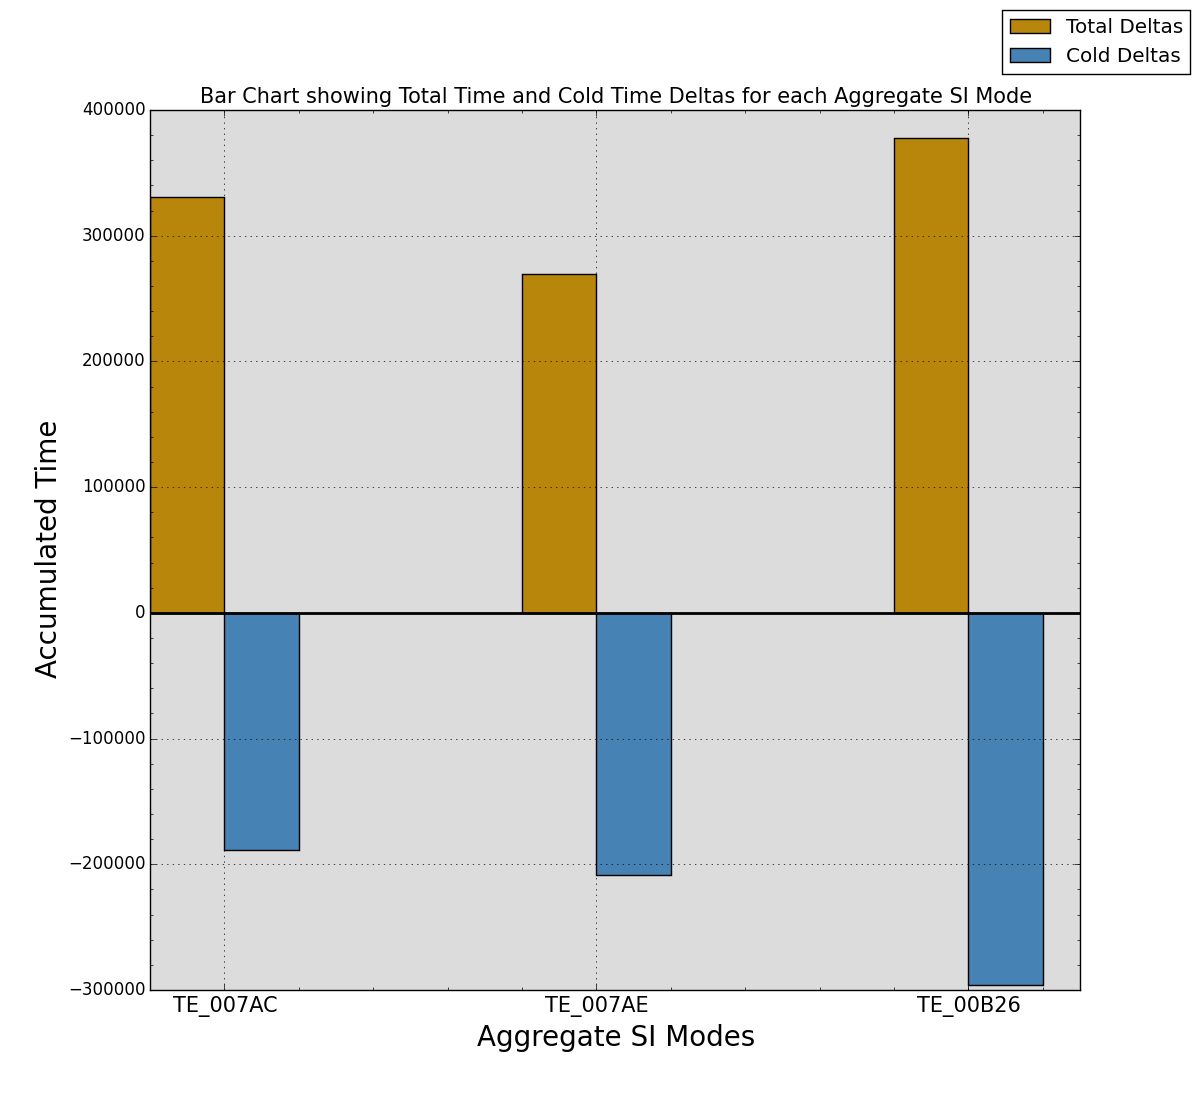
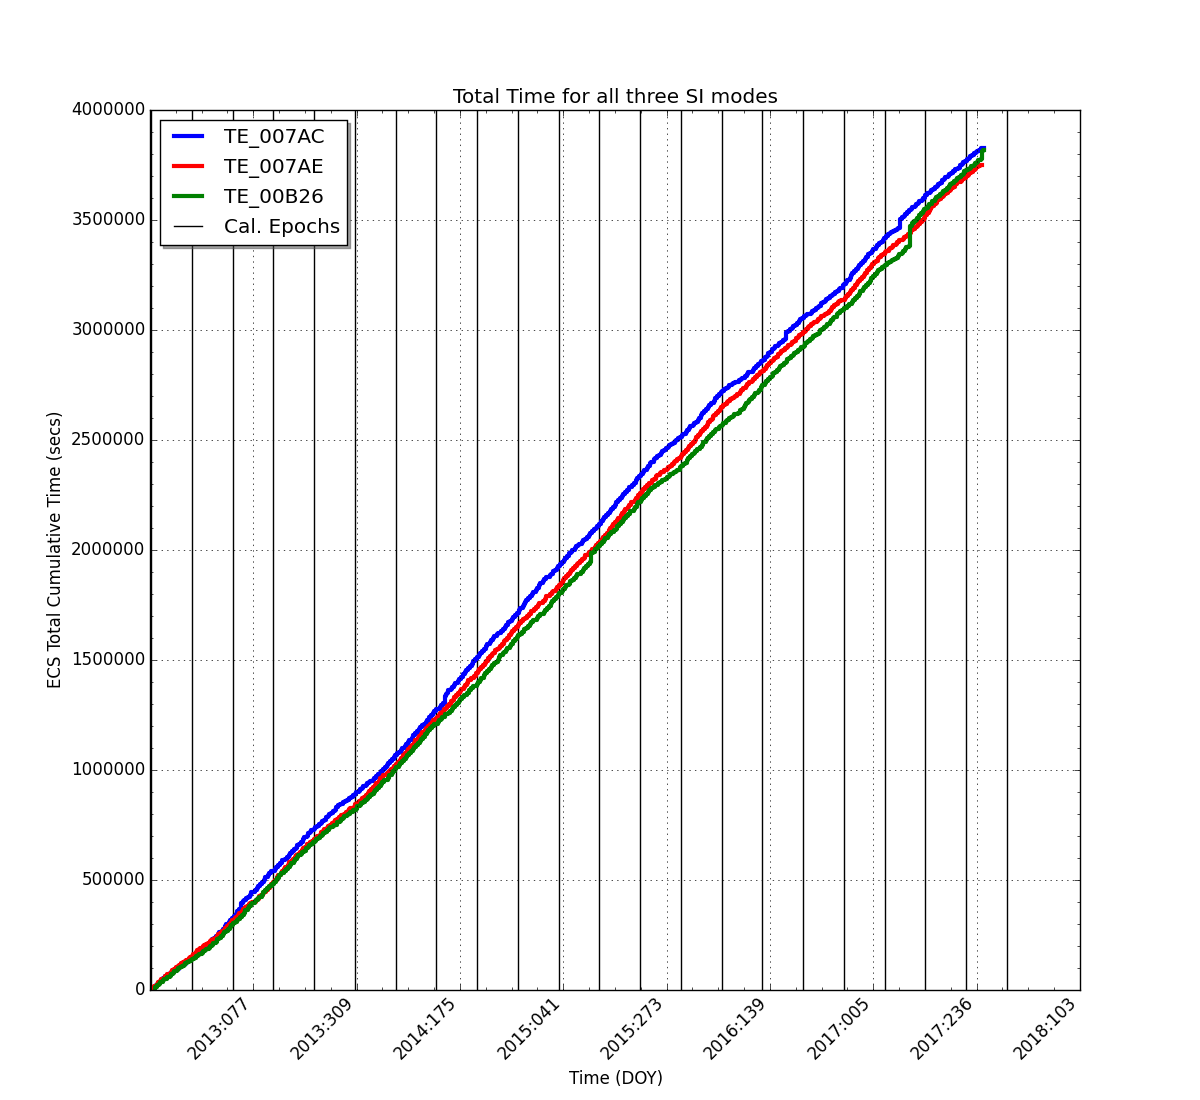
| Stats | TE_007AC | TE_007AE | TE_00B26 |
|---|---|---|---|
| Total Expected Time (secs) | 3496000 | 3480800 | 3442800 |
| Total Actual Time (secs) | 3826402 | 3750649 | 3820343 |
| Delta From Expected (secs) | 330402.52 | 269849.04 | 377543.65 |
| % of Expected Total (secs) | 109.45% | 107.75% | 110.97% |
| Stats | TE_007AC | TE_007AE | TE_00B26 |
|---|---|---|---|
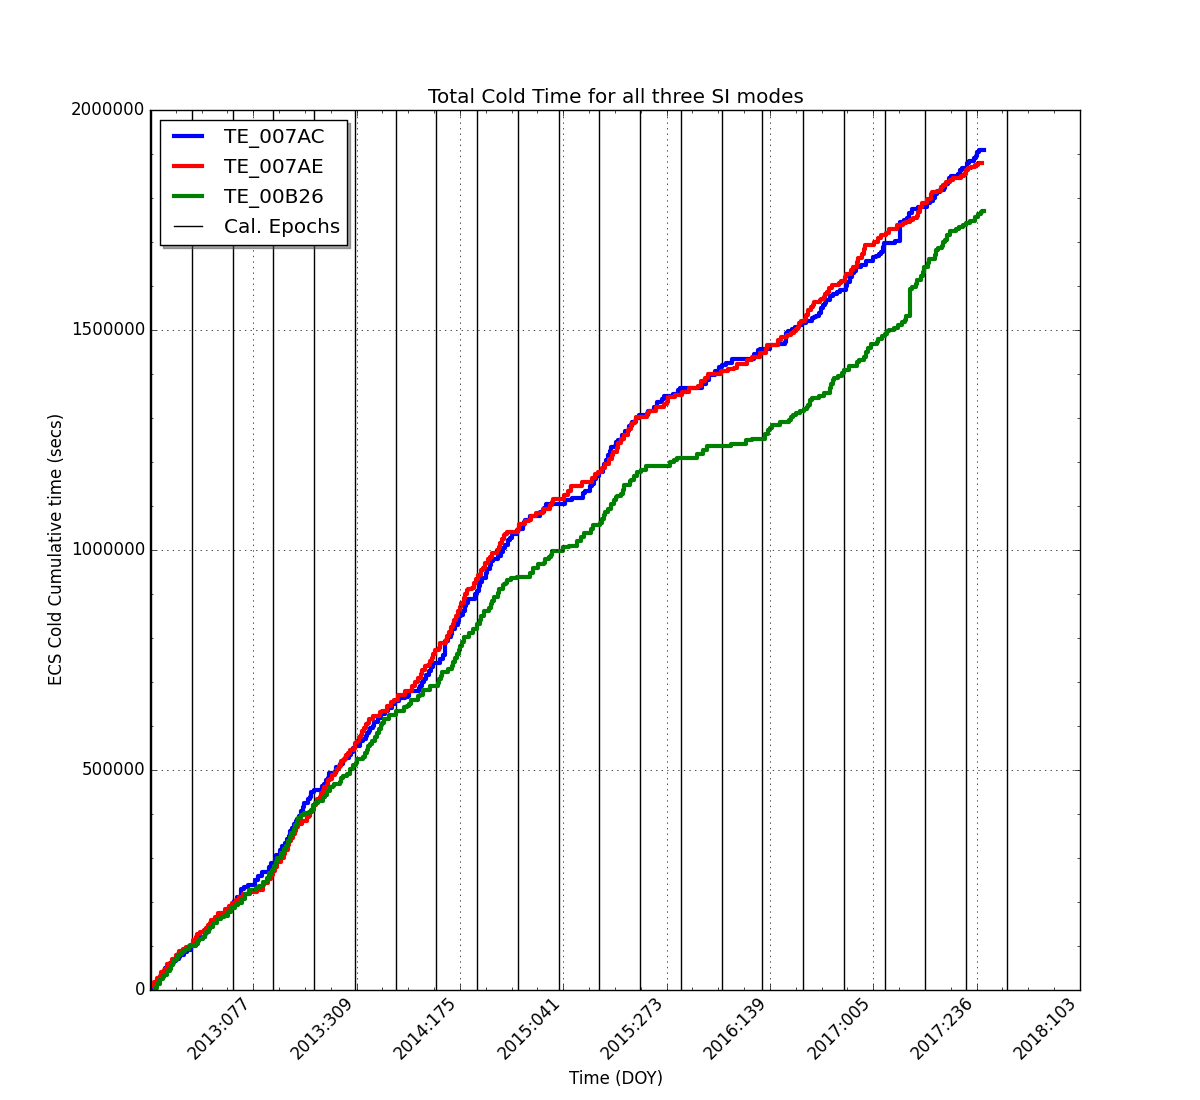
| Total Exp. Cold Time (secs) | 2097600.0 | 2088480.0 | 2065680.0 |
| Total Actual Cold Time (secs) | 1908682 | 1880298 | 1769842 |
| Delta From Expected (secs) | -188917.41 | -208181.20 | -295837.77 |
| % of Exp. Cold Total (secs) | 90.99% | 90.03% | 85.68% |
| SI Mode | Total Number of Obs. | Total Exposure Time (sec) | Average Exposure (sec/obs) | |
|---|---|---|---|---|
| Primary 6 Chip SI Modes | TE_007AC | 458 | 3773125.52 | 8238.27 |
| TE_007AE | 456 | 3734839.04 | 8190.44 | |
| TE_00B26 | 449 | 3682161.93 | 8200.81 | Old 6 Chip SI Modes | TE_00216 | 5 | 478338.25 | 95667.65 |
| TE_0021C | 0 | 0.00 | 0.00 | |
| TE_008EA | 0 | 0.00 | 0.00 | 5 Chip SI Modes | TE_00C60 | 3 | 23932.00 | 7977.33 |
| TE_00CA8 | 2 | 15810.00 | 7905.00 | 4 Chip SI Modes | TE_00C62 | 3 | 167526.73 | 55842.24 |