II. Rolling Monthly
The present targets for the Total and Cold times are:
Total time per SI Mode per measurement: 7600.0 seconds
Fraction of total time the measurement should be cold: 60.0%
Back To Top
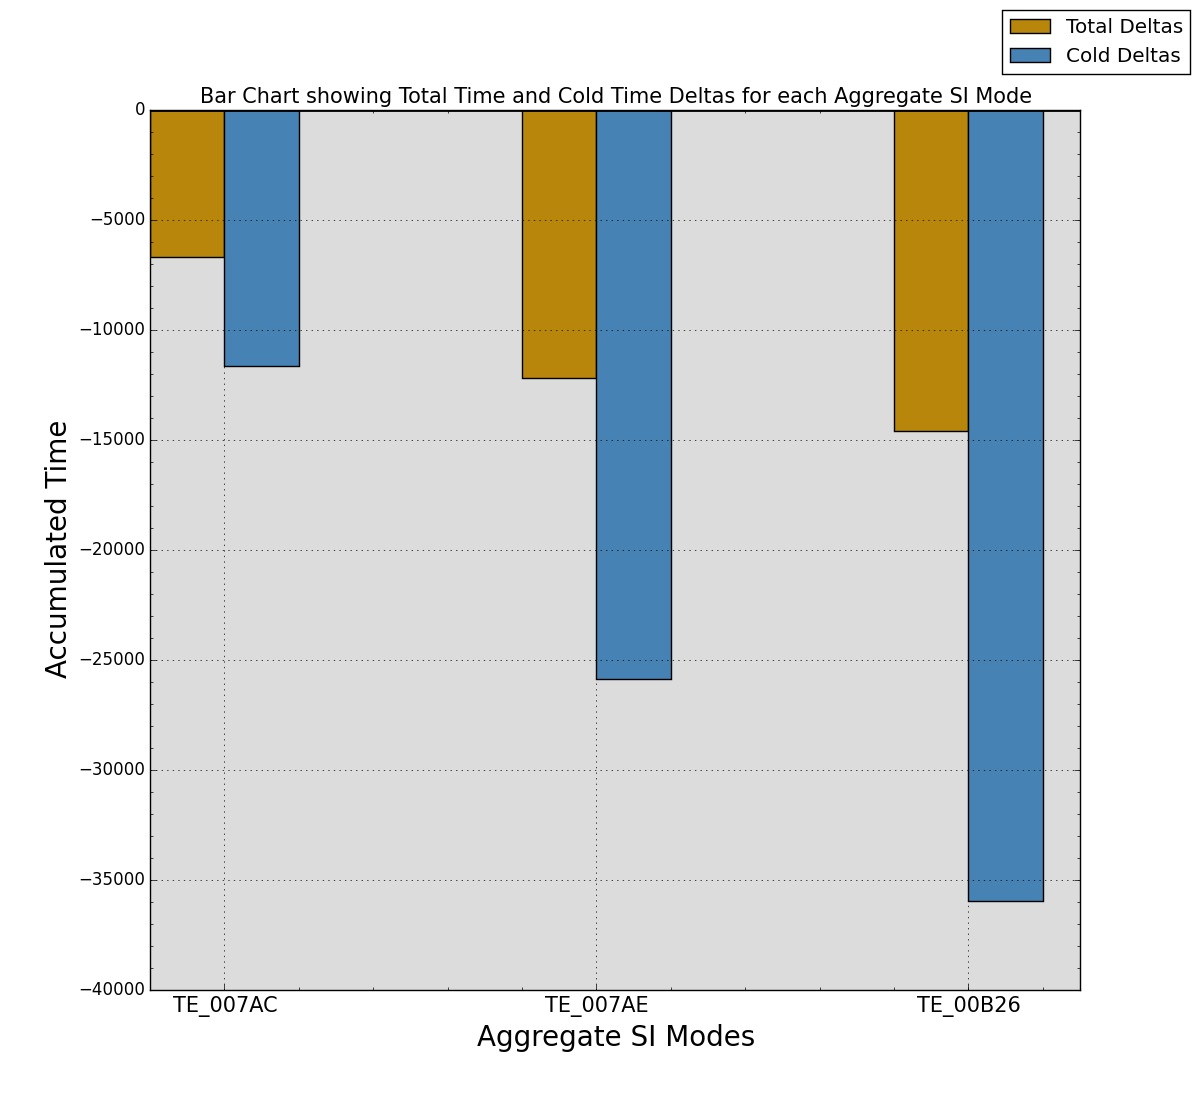
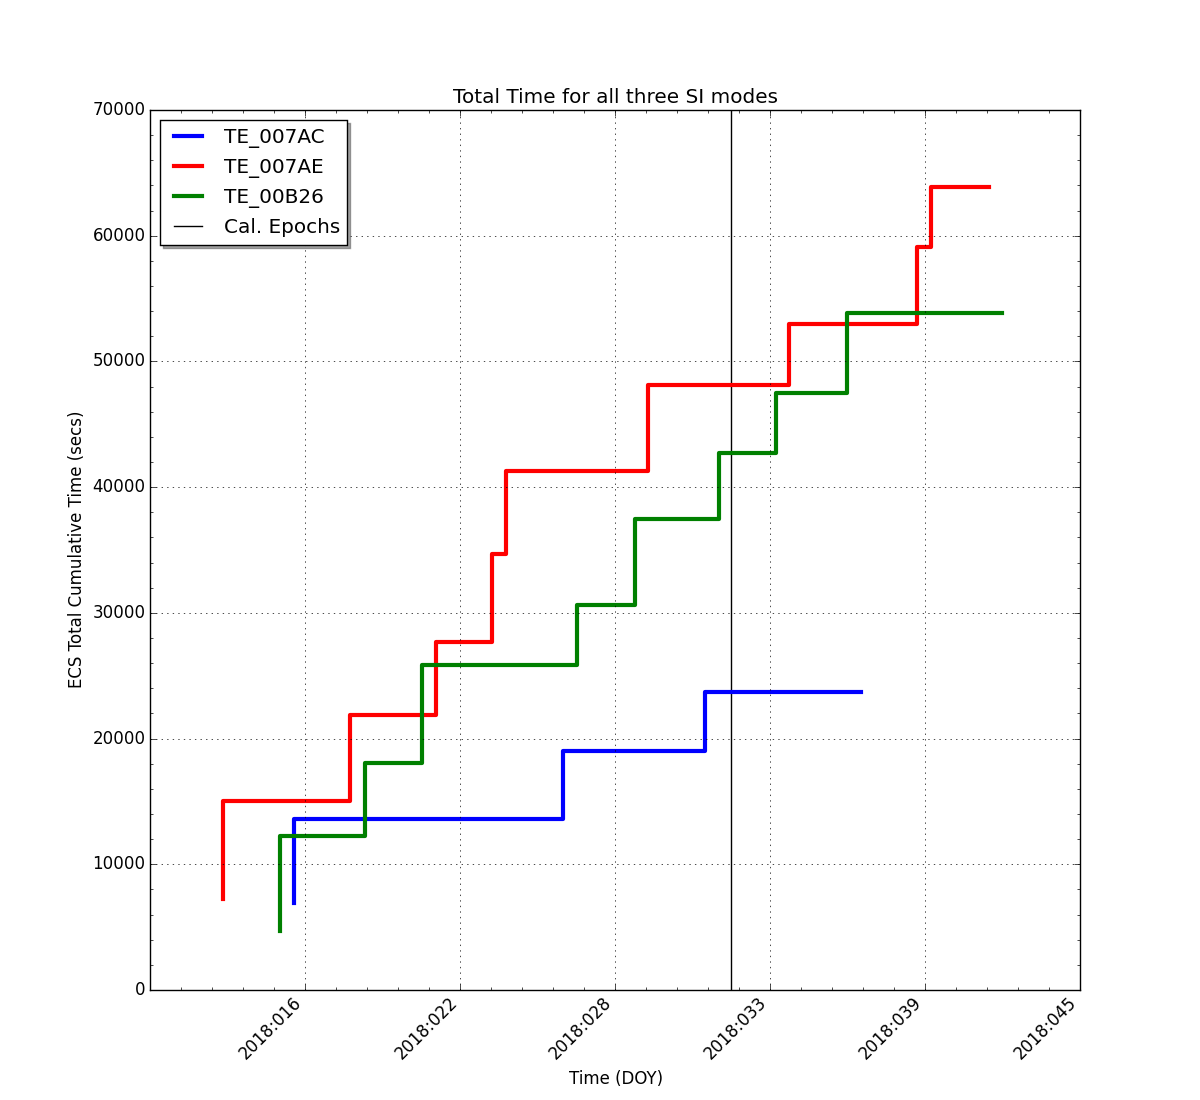
| Stats | TE_007AC | TE_007AE | TE_00B26 |
|---|---|---|---|
| Total Expected Time (secs) | 30400 | 76000 | 68400 |
| Total Actual Time (secs) | 23714 | 63835 | 53822 |
| Delta From Expected (secs) | -6685.00 | -12164.00 | -14577.00 |
| % of Expected Total (secs) | 78.01% | 83.99% | 78.69% |
| Stats | TE_007AC | TE_007AE | TE_00B26 |
|---|---|---|---|
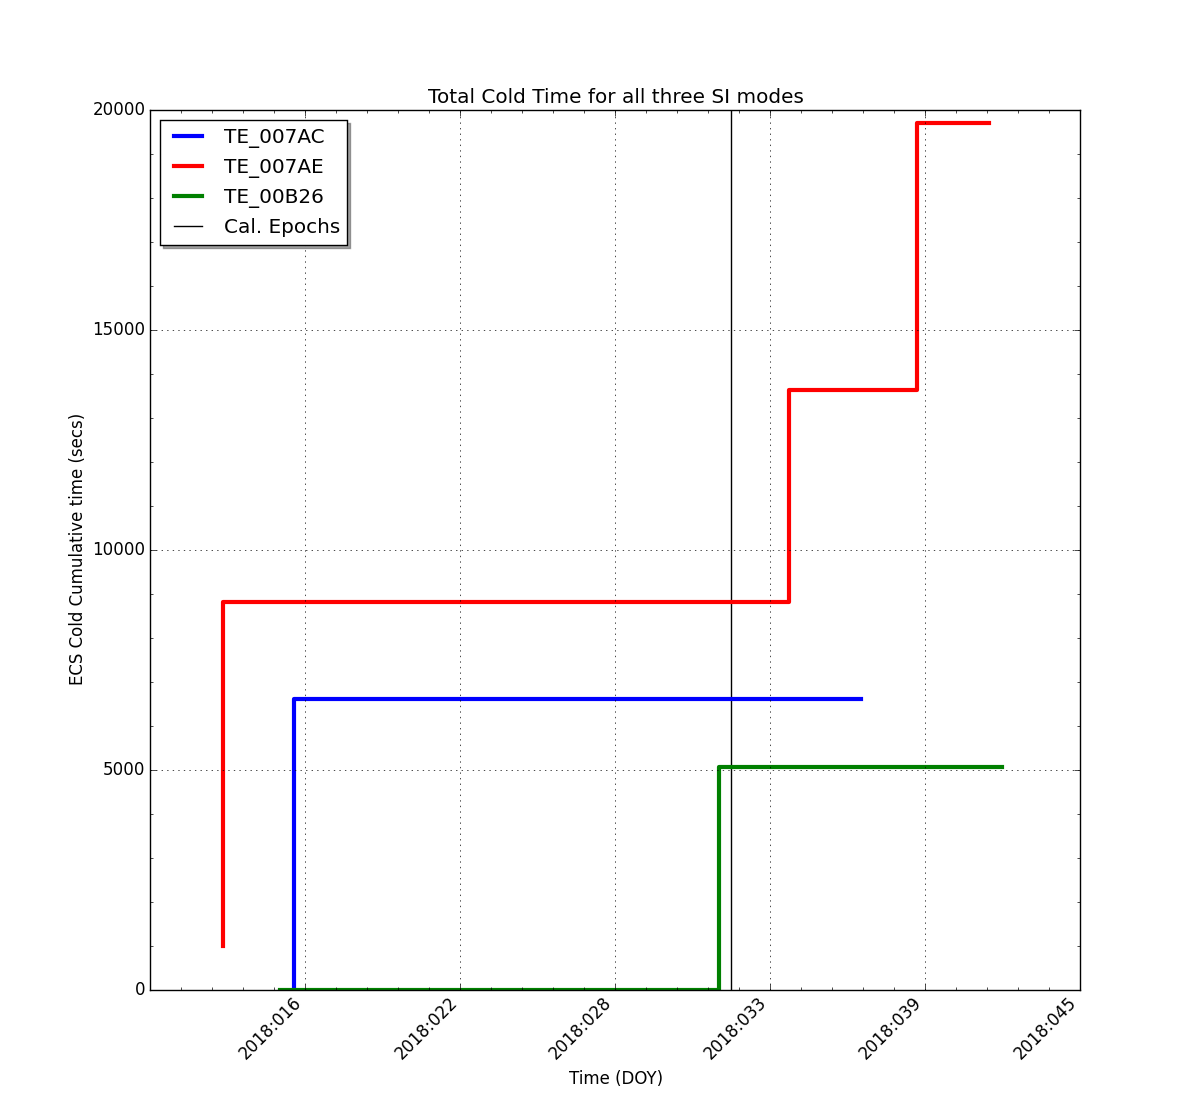
| Total Exp. Cold Time (secs) | 18240.0 | 45600.0 | 41040.0 |
| Total Actual Cold Time (secs) | 6602 | 19714 | 5077 |
| Delta From Expected (secs) | -11637.21 | -25885.15 | -35962.15 |
| % of Exp. Cold Total (secs) | 36.20% | 43.23% | 12.37% |
| SI Mode | Total Number of Obs. | Total Exposure Time (sec) | Average Exposure (sec/obs) | |
|---|---|---|---|---|
| Primary 6 Chip SI Modes | TE_007AC | 4 | 23715.00 | 5928.75 |
| TE_007AE | 9 | 59005.00 | 6556.11 | |
| TE_00B26 | 8 | 48021.00 | 6002.62 | Old 6 Chip SI Modes | TE_00216 | 0 | 0.00 | 0.00 |
| TE_0021C | 0 | 0.00 | 0.00 | |
| TE_008EA | 0 | 0.00 | 0.00 | 5 Chip SI Modes | TE_00C60 | 1 | 5802.00 | 5802.00 |
| TE_00CA8 | 1 | 4831.00 | 4831.00 | 4 Chip SI Modes | TE_00C62 | 0 | 0.00 | 0.00 |
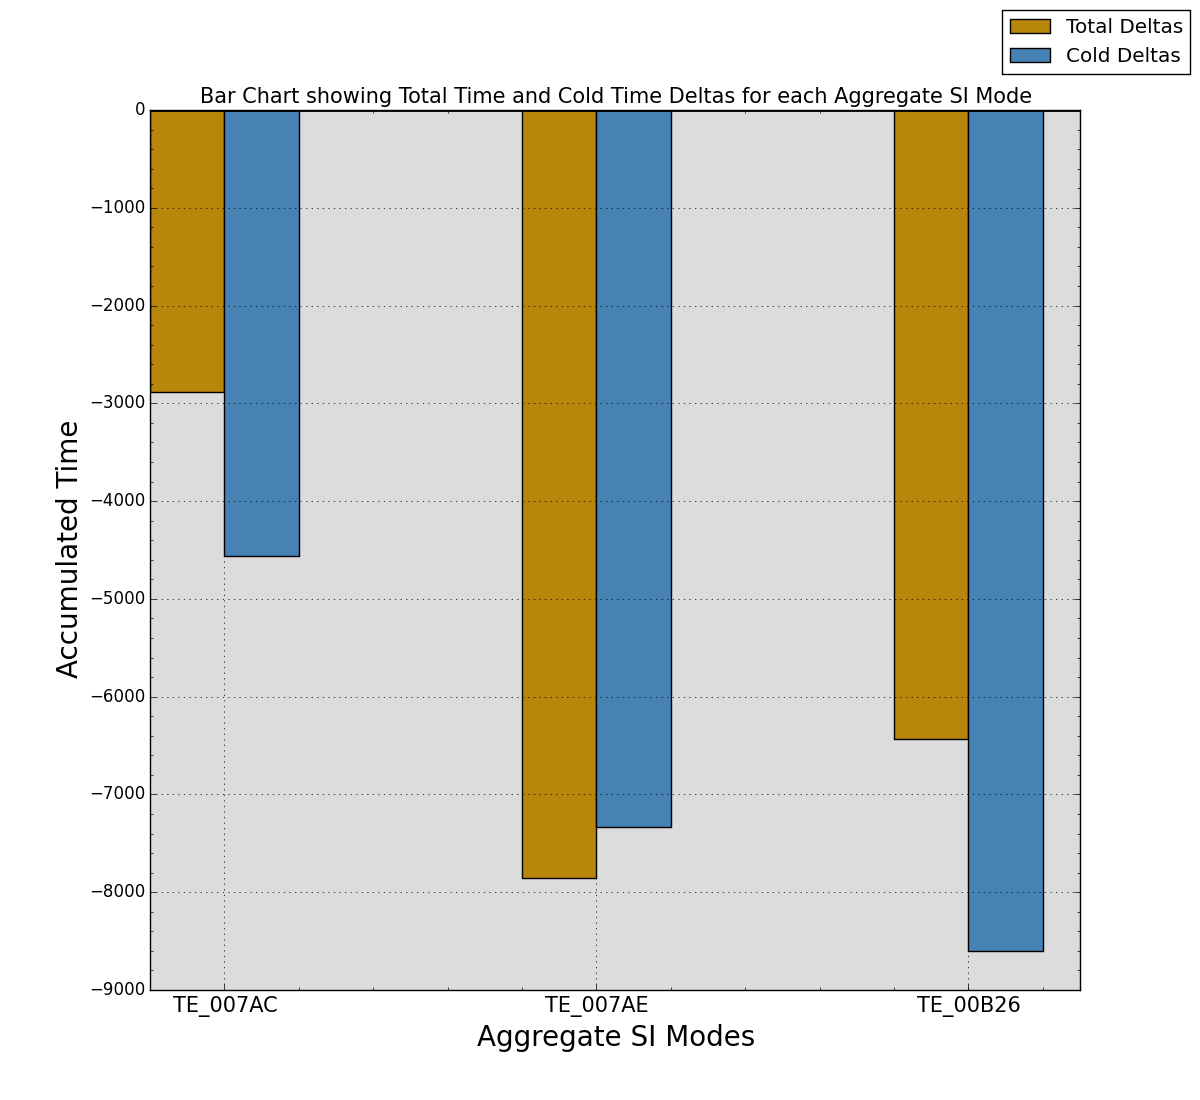
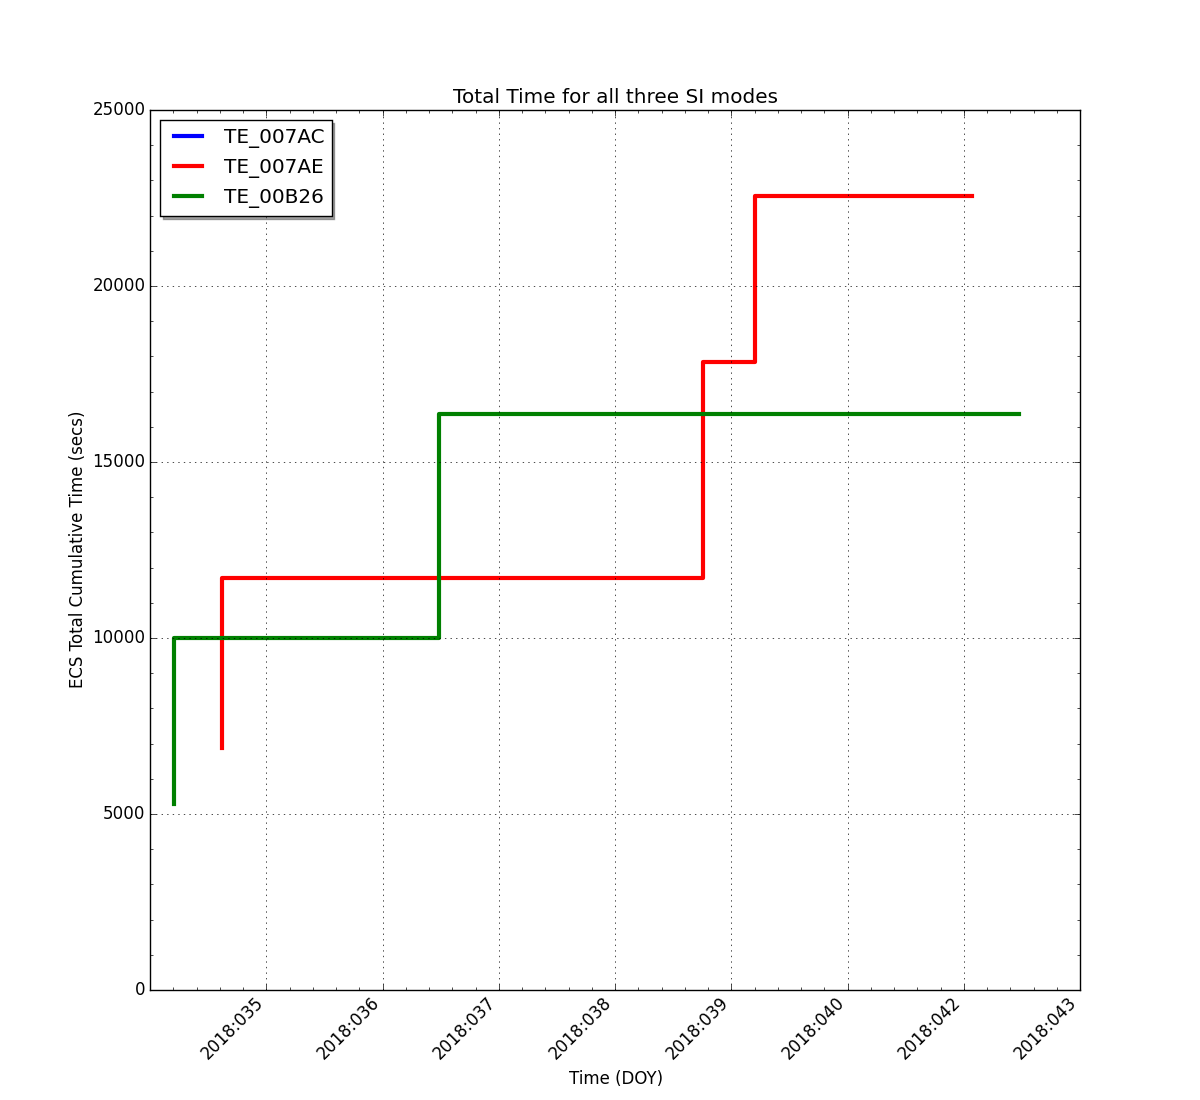
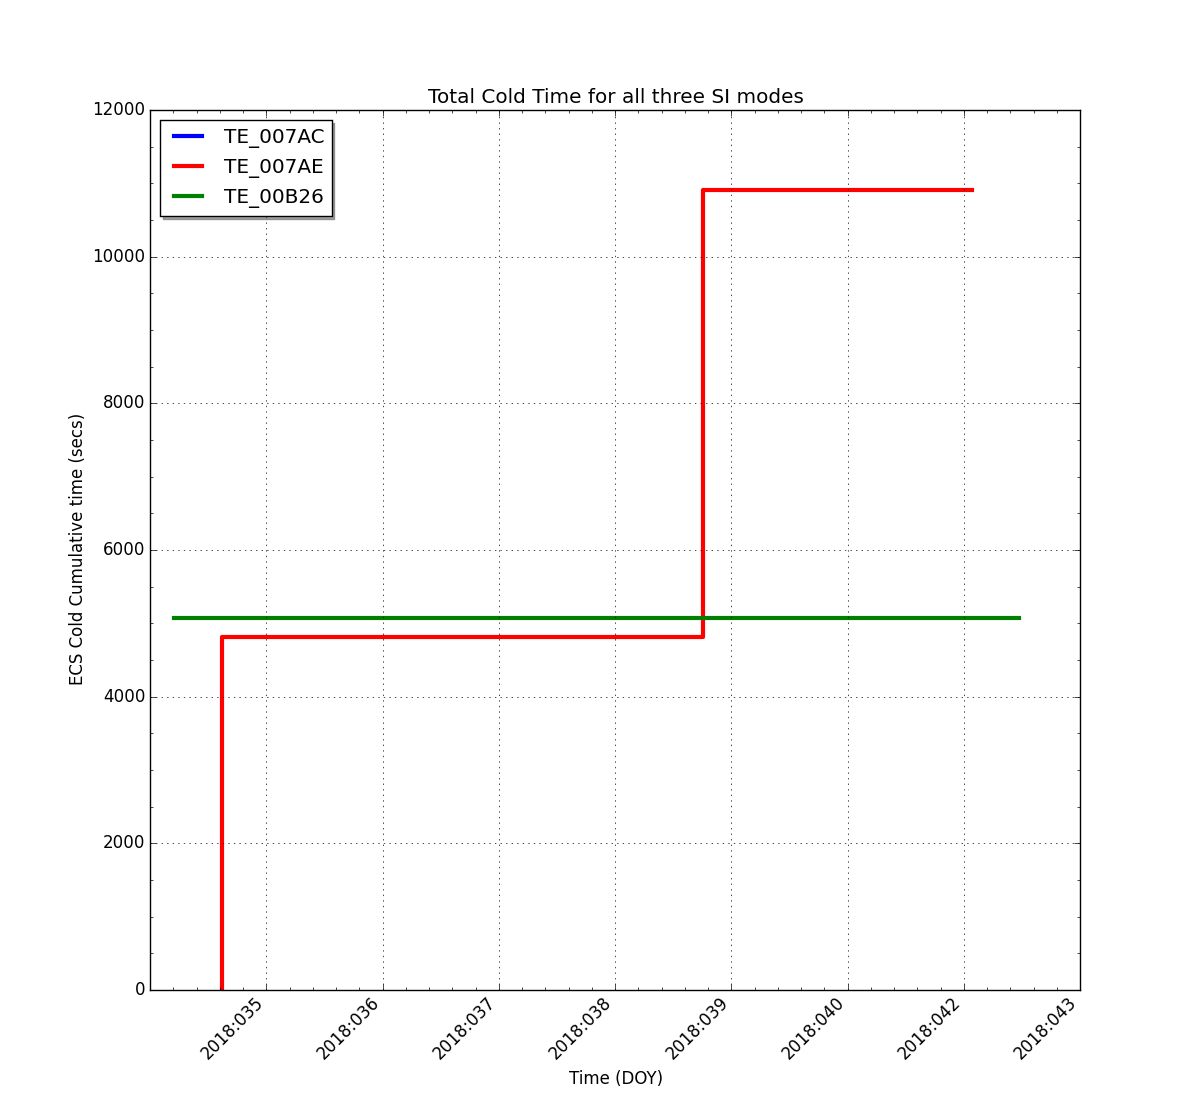
III. Statistics Since the Start of the Current Epoch
| Stats | TE_007AC | TE_007AE | TE_00B26 |
|---|---|---|---|
| Total Expected Time (secs) | 7600 | 30400 | 22800 |
| Total Actual Time (secs) | 4716 | 22543 | 16364 |
| Delta From Expected (secs) | -2883.00 | -7856.00 | -6436.00 |
| % of Expected Total (secs) | 62.07% | 74.16% | 71.77% |
| Stats | TE_007AC | TE_007AE | TE_00B26 |
|---|---|---|---|
| Total Exp. Cold Time (secs) | 4560.0 | 18240.0 | 13680.0 |
| Total Actual Cold Time (secs) | 0 | 10903 | 5077 |
| Delta From Expected (secs) | -4560.00 | -7336.56 | -8602.15 |
| % of Exp. Cold Total (secs) | 0.00% | 59.78% | 37.12% |
| SI Mode | Total Number of Obs. | Total Exposure Time (sec) | Average Exposure (sec/obs) | |
|---|---|---|---|---|
| Primary 6 Chip SI Modes | TE_007AC | 1 | 4717.00 | 4717.00 |
| TE_007AE | 3 | 17713.00 | 5904.33 | |
| TE_00B26 | 3 | 16364.00 | 5454.67 | Old 6 Chip SI Modes | TE_00216 | 0 | 0.00 | 0.00 |
| TE_0021C | 0 | 0.00 | 0.00 | |
| TE_008EA | 0 | 0.00 | 0.00 | 5 Chip SI Modes | TE_00C60 | 0 | 0.00 | 0.00 |
| TE_00CA8 | 1 | 4831.00 | 4831.00 | 4 Chip SI Modes | TE_00C62 | 0 | 0.00 | 0.00 |
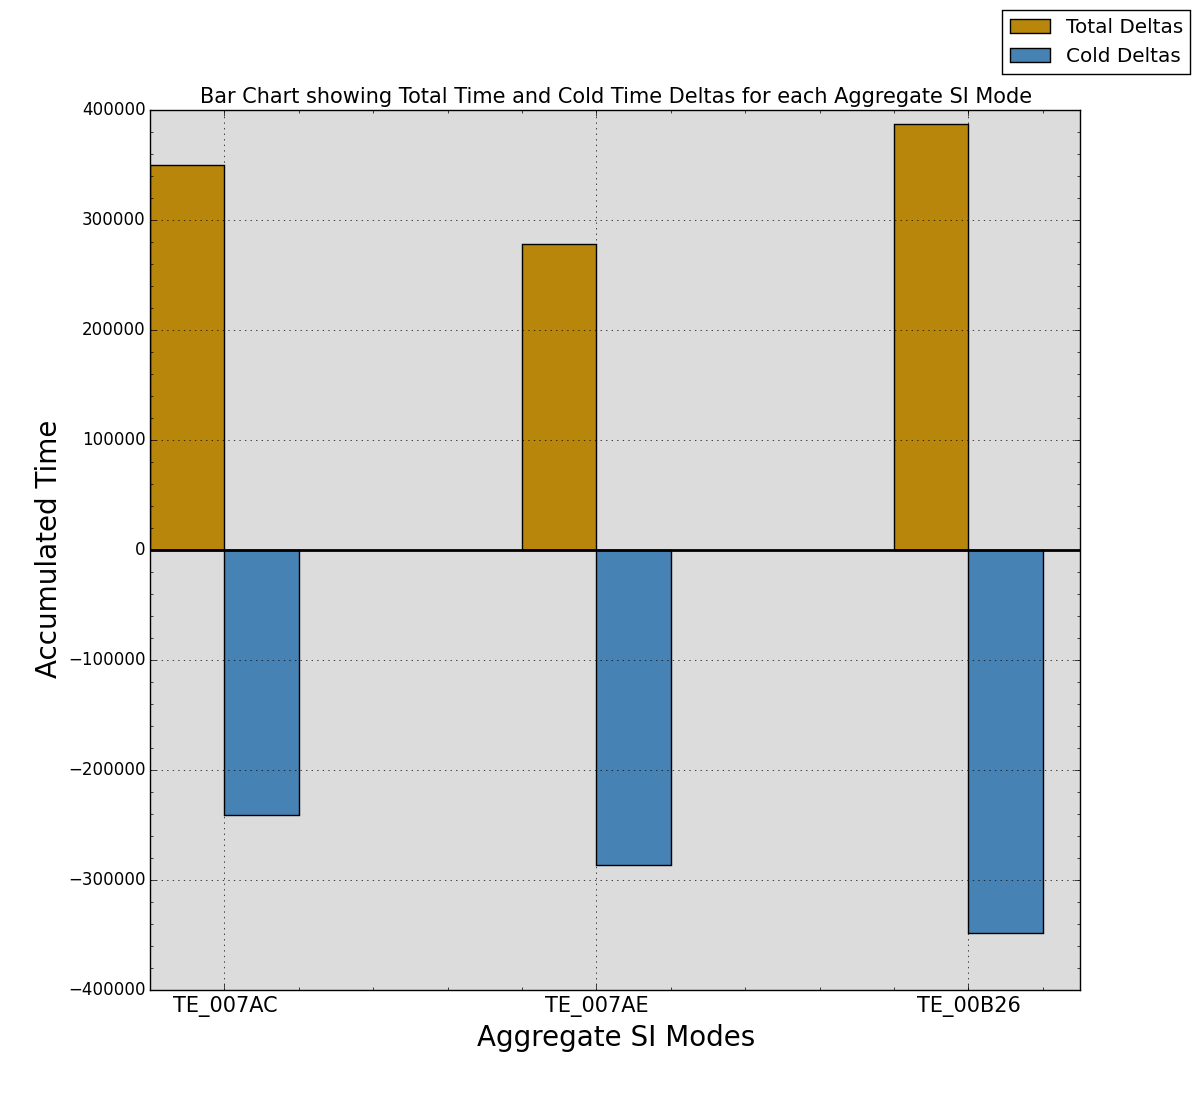
| Stats | TE_007AC | TE_007AE | TE_00B26 |
|---|---|---|---|
| Total Expected Time (secs) | 3754400 | 3762000 | 3777200 |
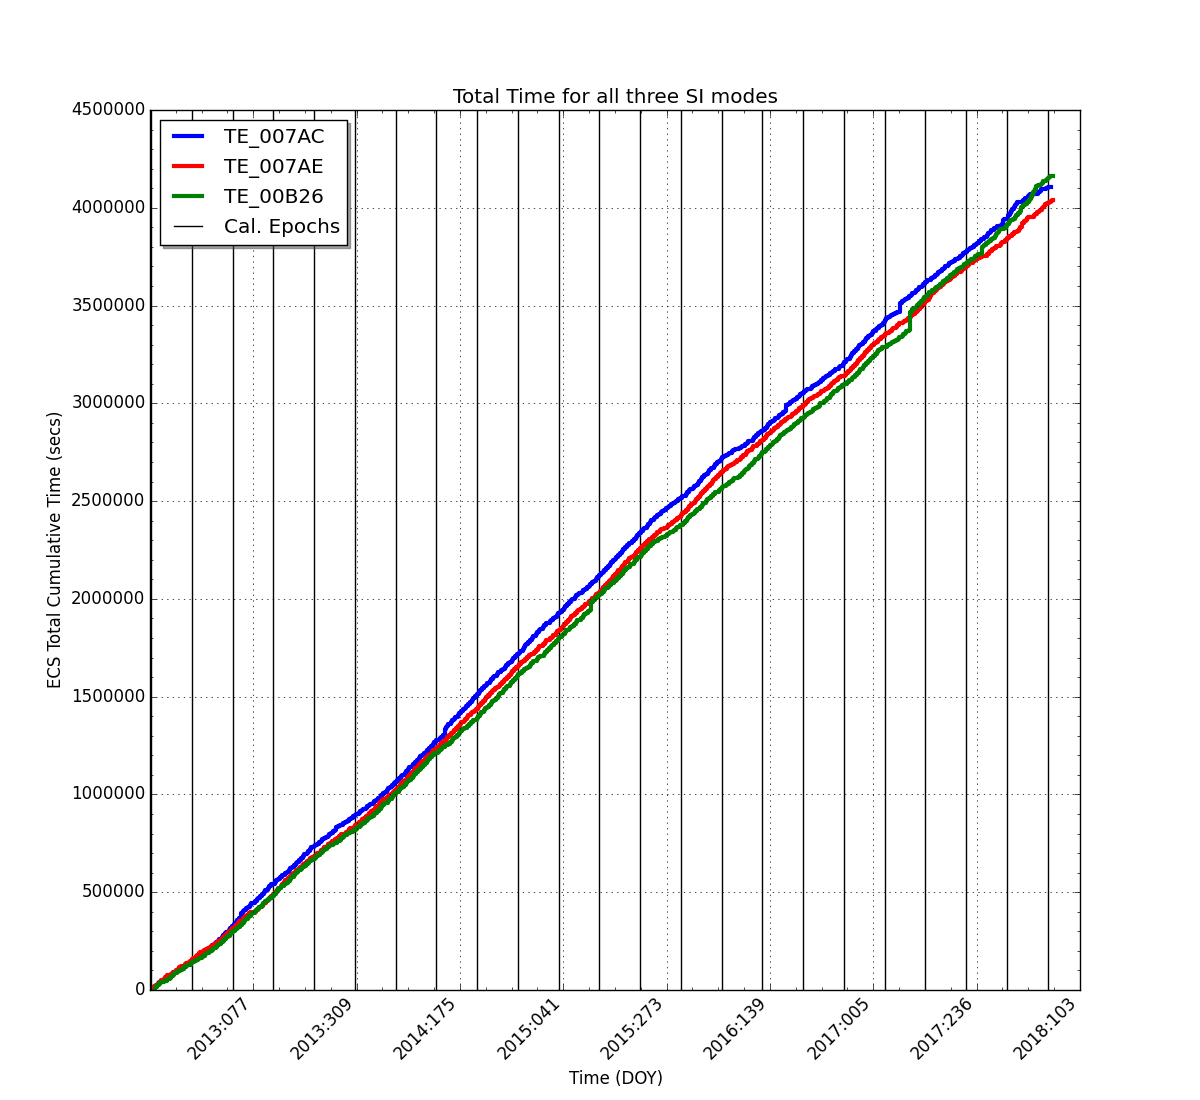
| Total Actual Time (secs) | 4104286 | 4039820 | 4164227 |
| Delta From Expected (secs) | 349886.52 | 277820.04 | 387027.65 |
| % of Expected Total (secs) | 109.32% | 107.38% | 110.25% |
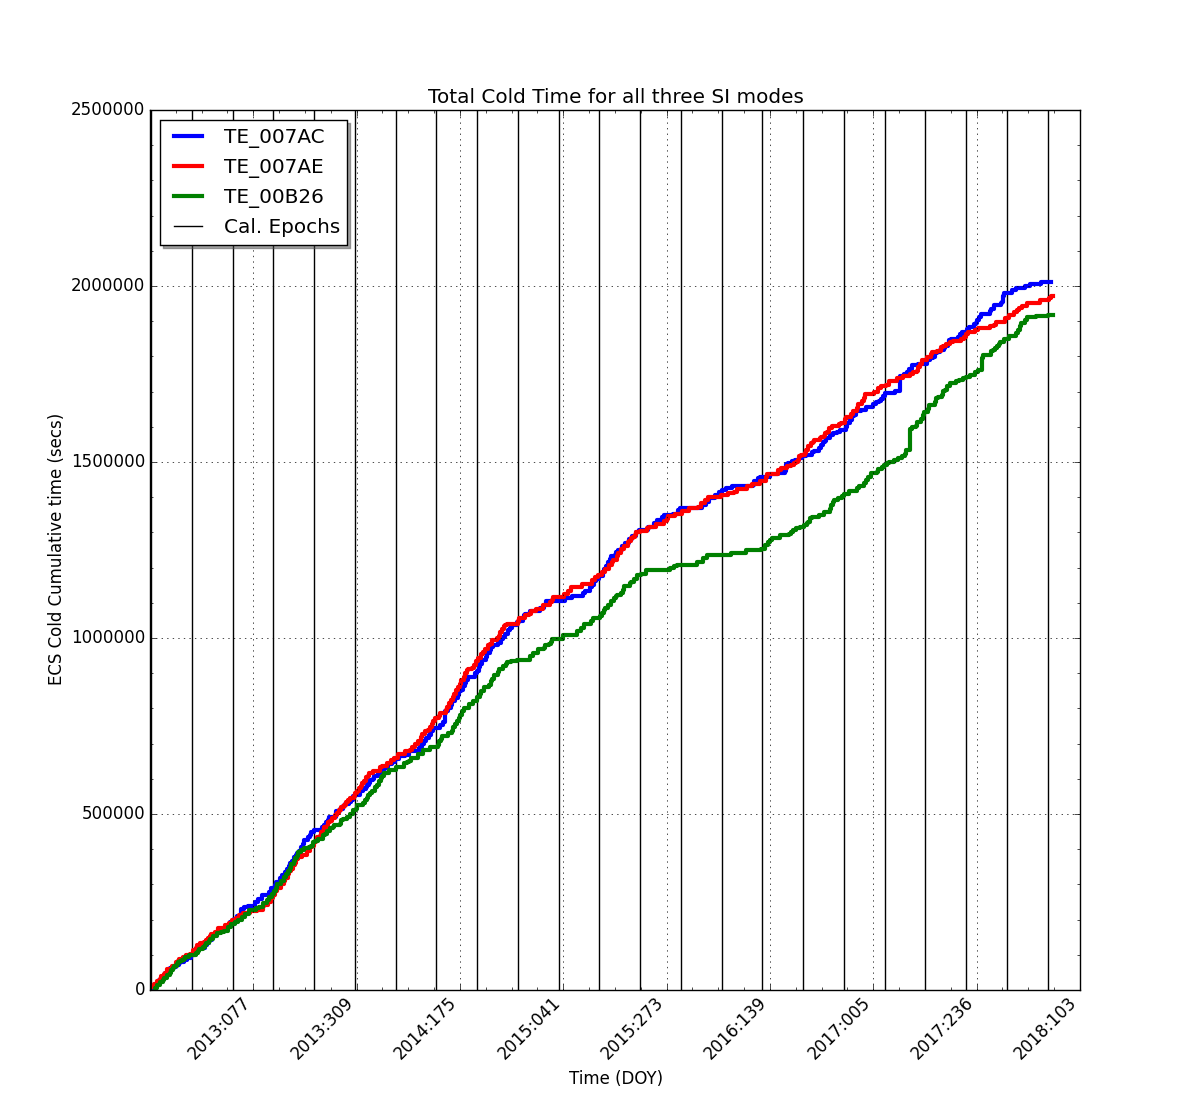
| Stats | TE_007AC | TE_007AE | TE_00B26 |
|---|---|---|---|
| Total Exp. Cold Time (secs) | 2252640.0 | 2257200.0 | 2266320.0 |
| Total Actual Cold Time (secs) | 2012159 | 1971130 | 1918455 |
| Delta From Expected (secs) | -240480.84 | -286069.80 | -347864.55 |
| % of Exp. Cold Total (secs) | 89.32% | 87.33% | 84.65% |
| SI Mode | Total Number of Obs. | Total Exposure Time (sec) | Average Exposure (sec/obs) | |
|---|---|---|---|---|
| Primary 6 Chip SI Modes | TE_007AC | 487 | 4008728.52 | 8231.48 |
| TE_007AE | 487 | 3976743.04 | 8165.80 | |
| TE_00B26 | 488 | 3984046.93 | 8164.03 | Old 6 Chip SI Modes | TE_00216 | 5 | 478338.25 | 95667.65 |
| TE_0021C | 0 | 0.00 | 0.00 | |
| TE_008EA | 0 | 0.00 | 0.00 | 5 Chip SI Modes | TE_00C60 | 13 | 108212.00 | 8324.00 |
| TE_00CA8 | 8 | 63077.00 | 7884.63 | 4 Chip SI Modes | TE_00C62 | 3 | 167526.73 | 55842.24 |
A word about the COLD Time stats:
- The Total Expected Cold Time value in the table below is 60.0% of the Total Expected Time (see Table above).
- Total Actual Cold Time is the sum of all time during each measurement where the temperature was <= -118.7 degrees C
- % of Expected Total is the fraction of the Total Expected Time achieved
SI Mode Mapping between 6,5 and 4 chip modes:
The 6 chip SI Modes consist of three distinct modes. But there are only 2, 5 chip SI Modes and only one 4 chip SI mode. To make tracking feasible, the 4 and 5 chip modes were mapped into the 6 chip modes in the following manner:
6 chip 5 chip 4 chip
TE_007AC -> TE_00C60 TE_00C62
TE_00B26 -> TE_00C60 TE_00C62
TE_007AE -> TE_00CA8
All of the TE_00CA8s get counted as TE_007AE
Half of the TE_00C60s get counted towards TE_007AC and the other half get counted with the TE_00B26s
Half of the TE_00C62s get counted towards TE_007AC and the other half get counted with the TE_00B26s.
So watchout for TE_00B26 over-representation.
Back To Top