II. Rolling Monthly
The present targets for the Total and Cold times are:
Total time per SI Mode per measurement: 7600.0 seconds
Fraction of total time the measurement should be cold: 60.0%
Back To Top
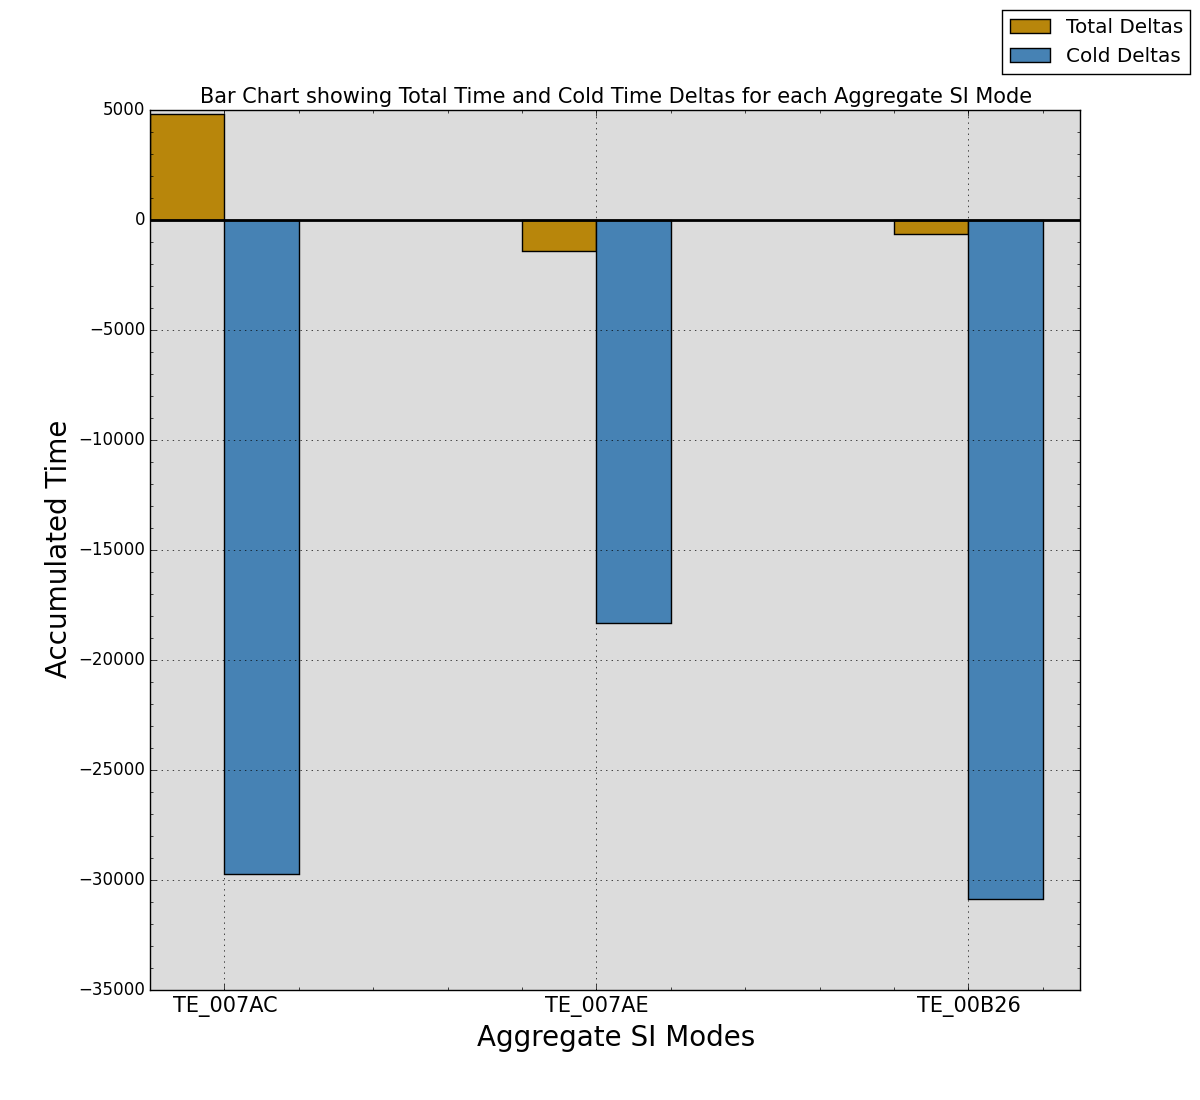
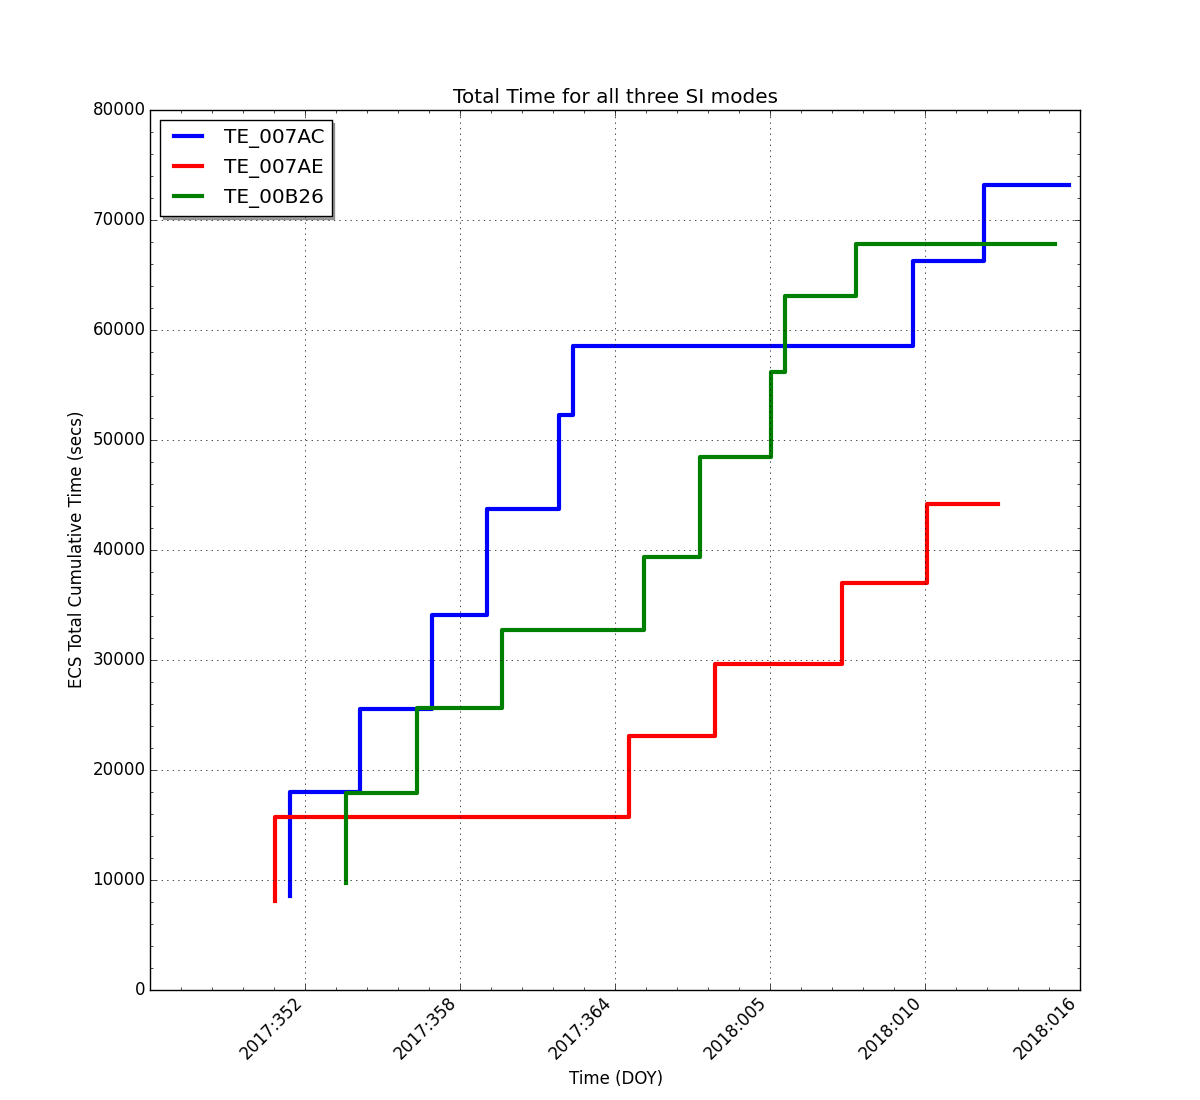
| Stats | TE_007AC | TE_007AE | TE_00B26 |
|---|---|---|---|
| Total Expected Time (secs) | 68400 | 45600 | 68400 |
| Total Actual Time (secs) | 73199 | 44187 | 67775 |
| Delta From Expected (secs) | 4799.00 | -1413.00 | -624.00 |
| % of Expected Total (secs) | 107.02% | 96.90% | 99.09% |
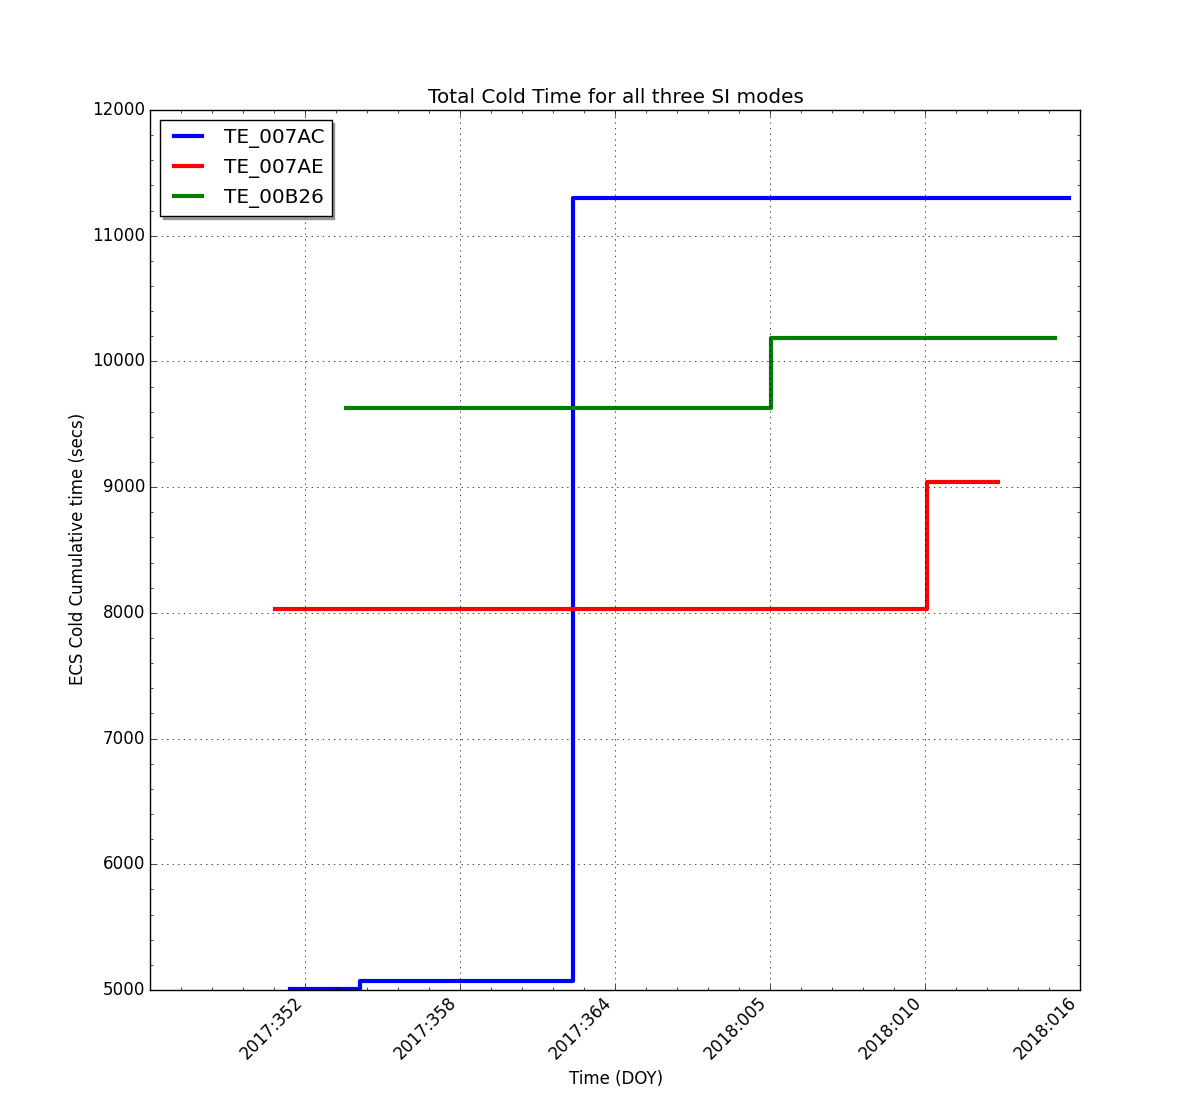
| Stats | TE_007AC | TE_007AE | TE_00B26 |
|---|---|---|---|
| Total Exp. Cold Time (secs) | 41040.0 | 27360.0 | 41040.0 |
| Total Actual Cold Time (secs) | 11302 | 9042 | 10185 |
| Delta From Expected (secs) | -29737.84 | -18317.96 | -30854.06 |
| % of Exp. Cold Total (secs) | 27.54% | 33.05% | 24.82% |
| SI Mode | Total Number of Obs. | Total Exposure Time (sec) | Average Exposure (sec/obs) | |
|---|---|---|---|---|
| Primary 6 Chip SI Modes | TE_007AC | 6 | 46407.00 | 7734.50 |
| TE_007AE | 4 | 30352.00 | 7588.00 | |
| TE_00B26 | 6 | 44336.00 | 7389.33 | Old 6 Chip SI Modes | TE_00216 | 0 | 0.00 | 0.00 |
| TE_0021C | 0 | 0.00 | 0.00 | |
| TE_008EA | 0 | 0.00 | 0.00 | 5 Chip SI Modes | TE_00C60 | 6 | 50232.00 | 8372.00 |
| TE_00CA8 | 2 | 13835.00 | 6917.50 | 4 Chip SI Modes | TE_00C62 | 0 | 0.00 | 0.00 |
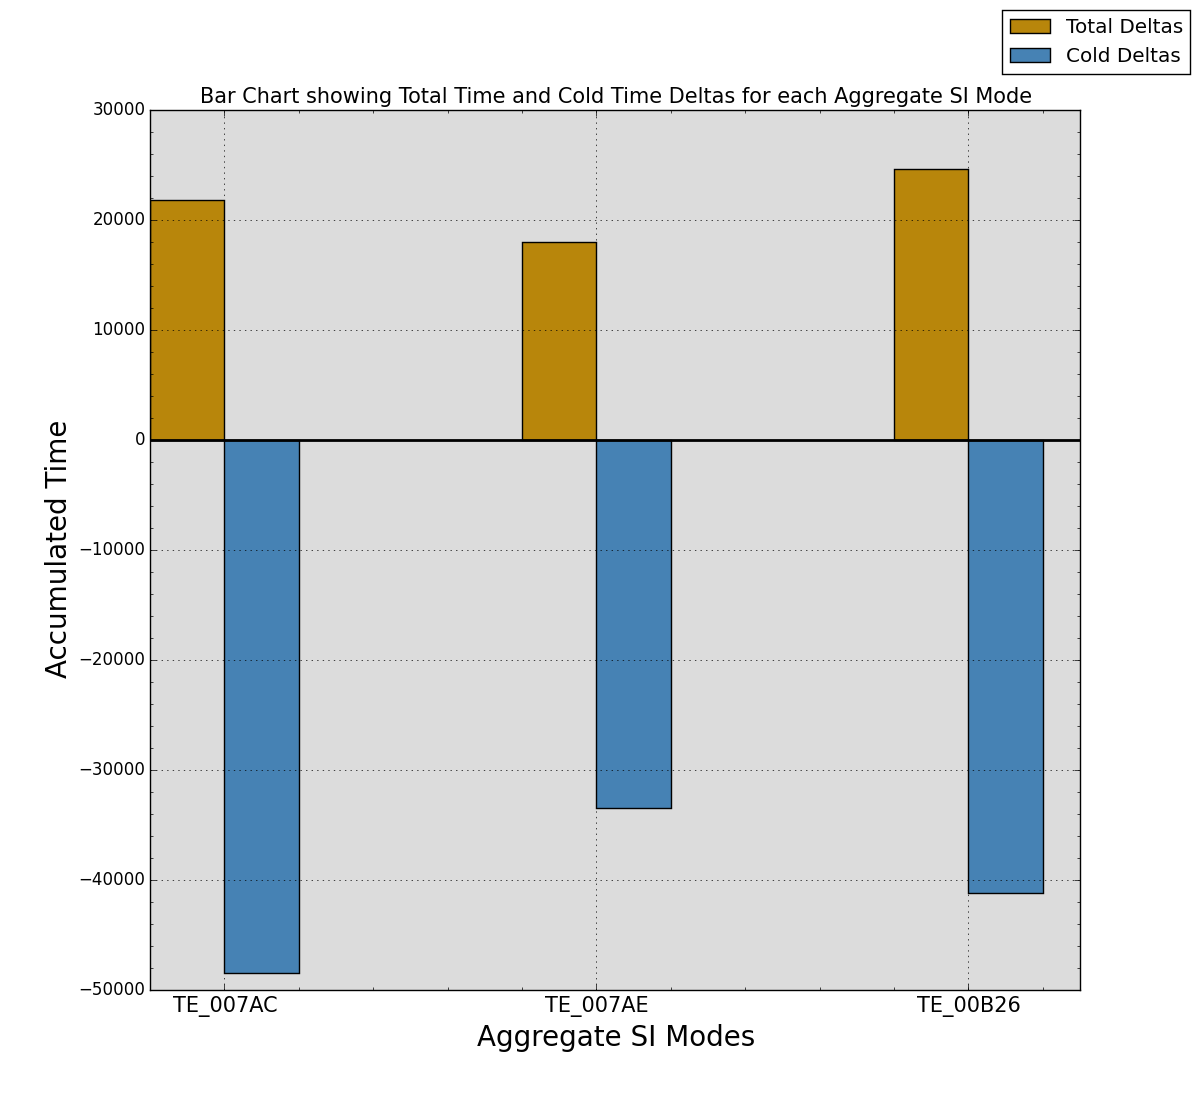
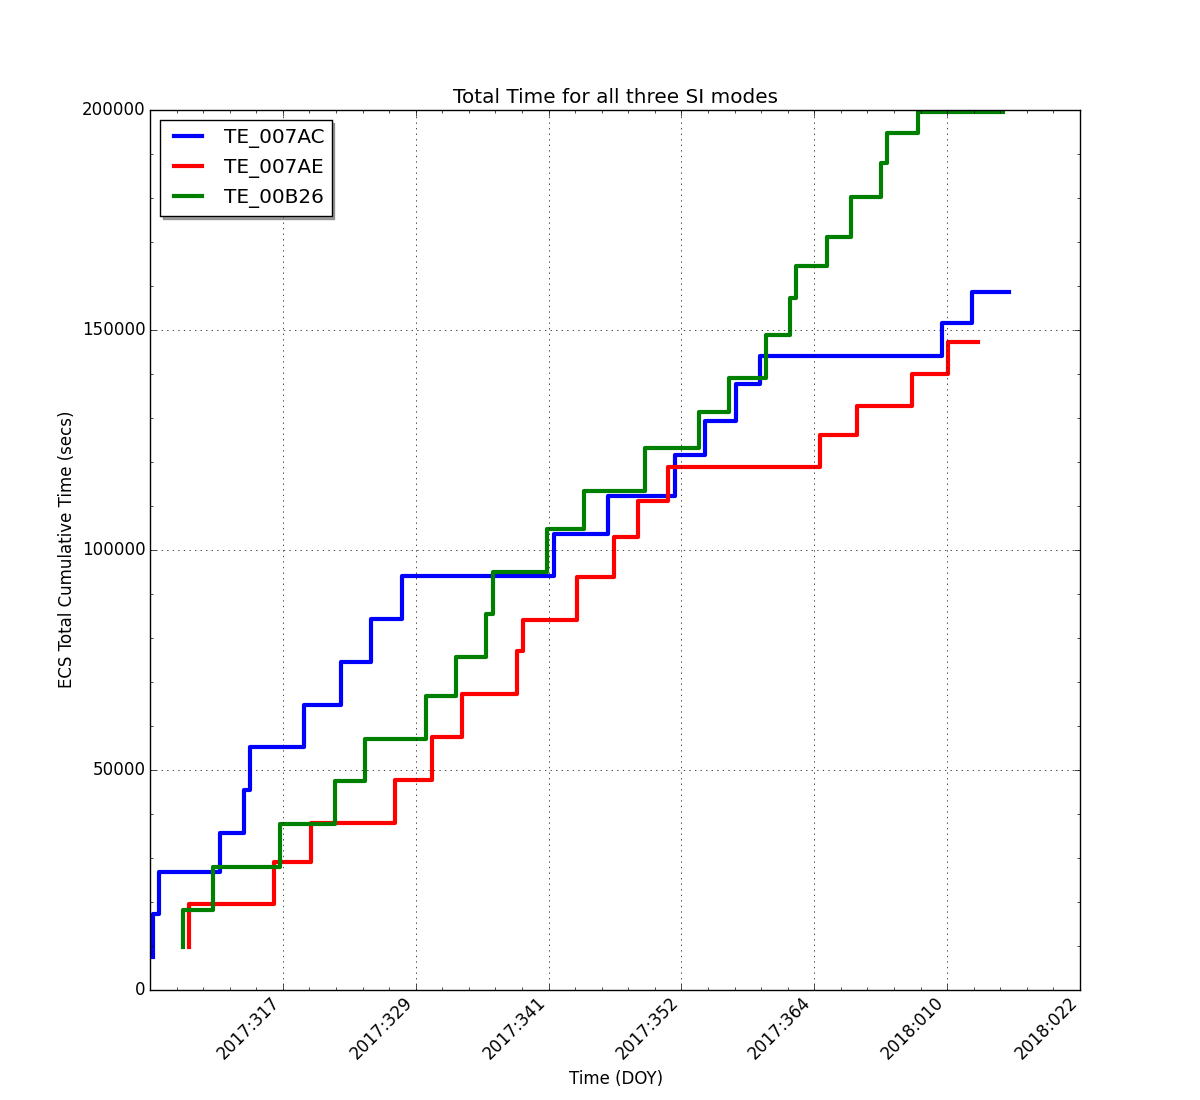
III. Statistics Since the Start of the Current Epoch
| Stats | TE_007AC | TE_007AE | TE_00B26 |
|---|---|---|---|
| Total Expected Time (secs) | 136800 | 129200 | 174800 |
| Total Actual Time (secs) | 158643 | 147215 | 199465 |
| Delta From Expected (secs) | 21843.00 | 18015.00 | 24665.00 |
| % of Expected Total (secs) | 115.97% | 113.94% | 114.11% |
| Stats | TE_007AC | TE_007AE | TE_00B26 |
|---|---|---|---|
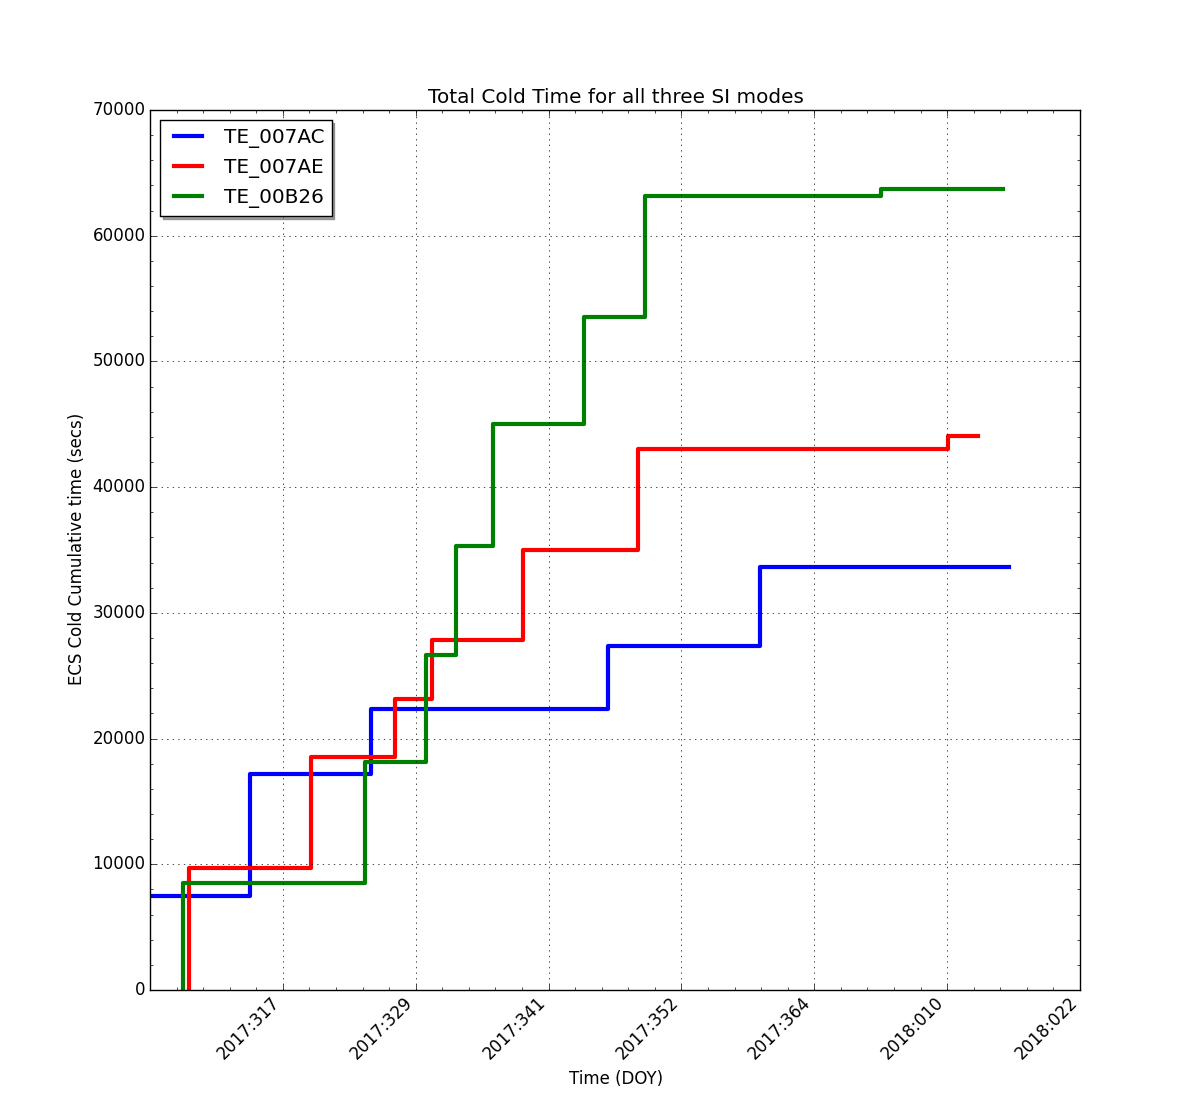
| Total Exp. Cold Time (secs) | 82080.0 | 77520.0 | 104880.0 |
| Total Actual Cold Time (secs) | 33617 | 44067 | 63711 |
| Delta From Expected (secs) | -48462.56 | -33452.68 | -41168.82 |
| % of Exp. Cold Total (secs) | 40.96% | 56.85% | 60.75% |
| SI Mode | Total Number of Obs. | Total Exposure Time (sec) | Average Exposure (sec/obs) | |
|---|---|---|---|---|
| Primary 6 Chip SI Modes | TE_007AC | 14 | 121872.00 | 8705.14 |
| TE_007AE | 12 | 104779.00 | 8731.58 | |
| TE_00B26 | 18 | 157758.00 | 8764.33 | Old 6 Chip SI Modes | TE_00216 | 0 | 0.00 | 0.00 |
| TE_0021C | 0 | 0.00 | 0.00 | |
| TE_008EA | 0 | 0.00 | 0.00 | 5 Chip SI Modes | TE_00C60 | 9 | 78478.00 | 8719.78 |
| TE_00CA8 | 5 | 42436.00 | 8487.20 | 4 Chip SI Modes | TE_00C62 | 0 | 0.00 | 0.00 |
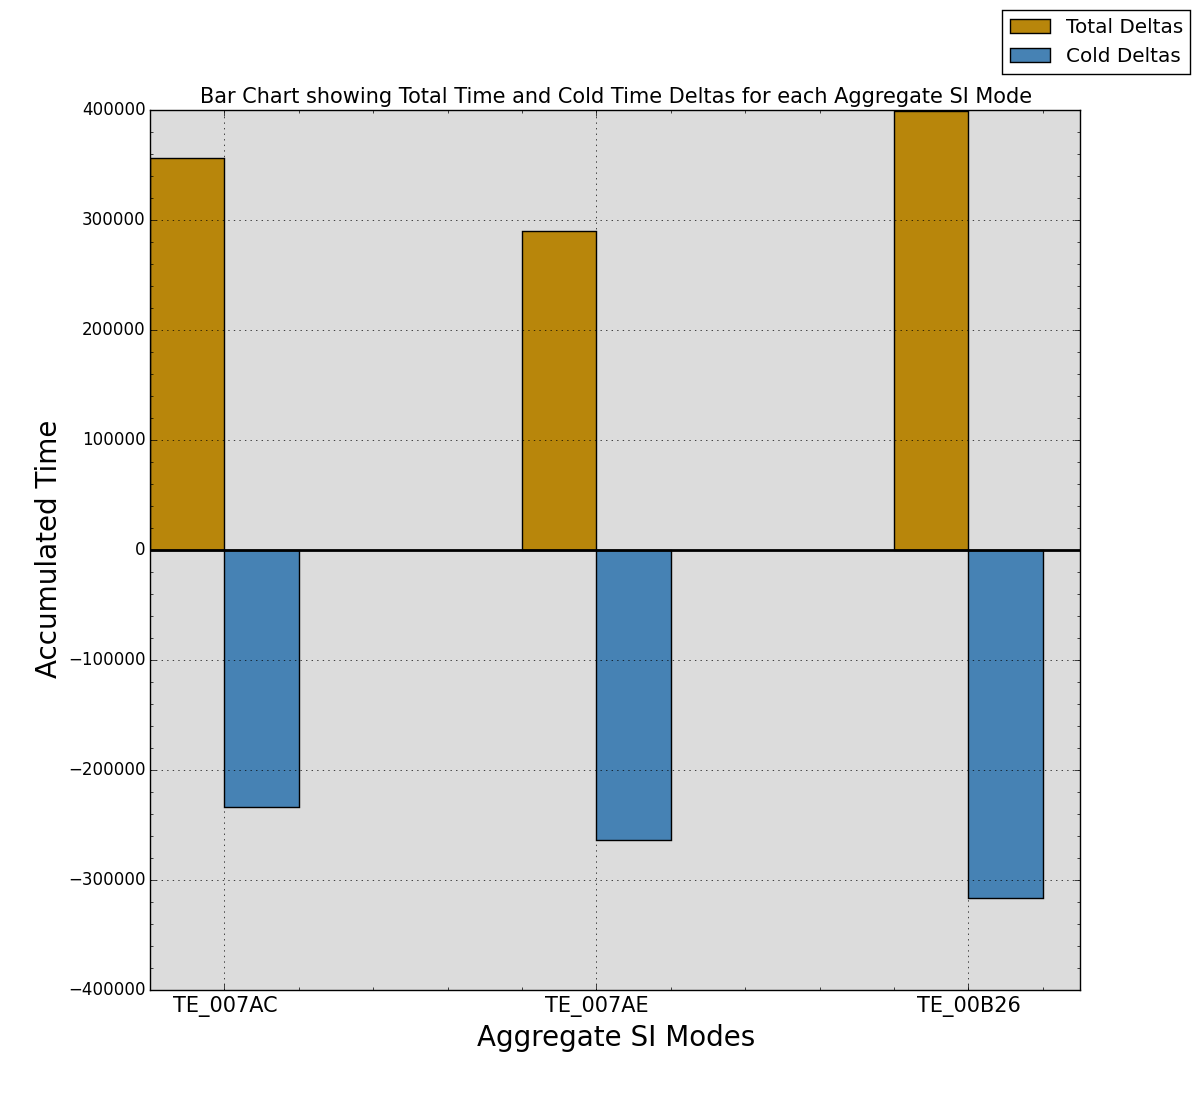
| Stats | TE_007AC | TE_007AE | TE_00B26 |
|---|---|---|---|
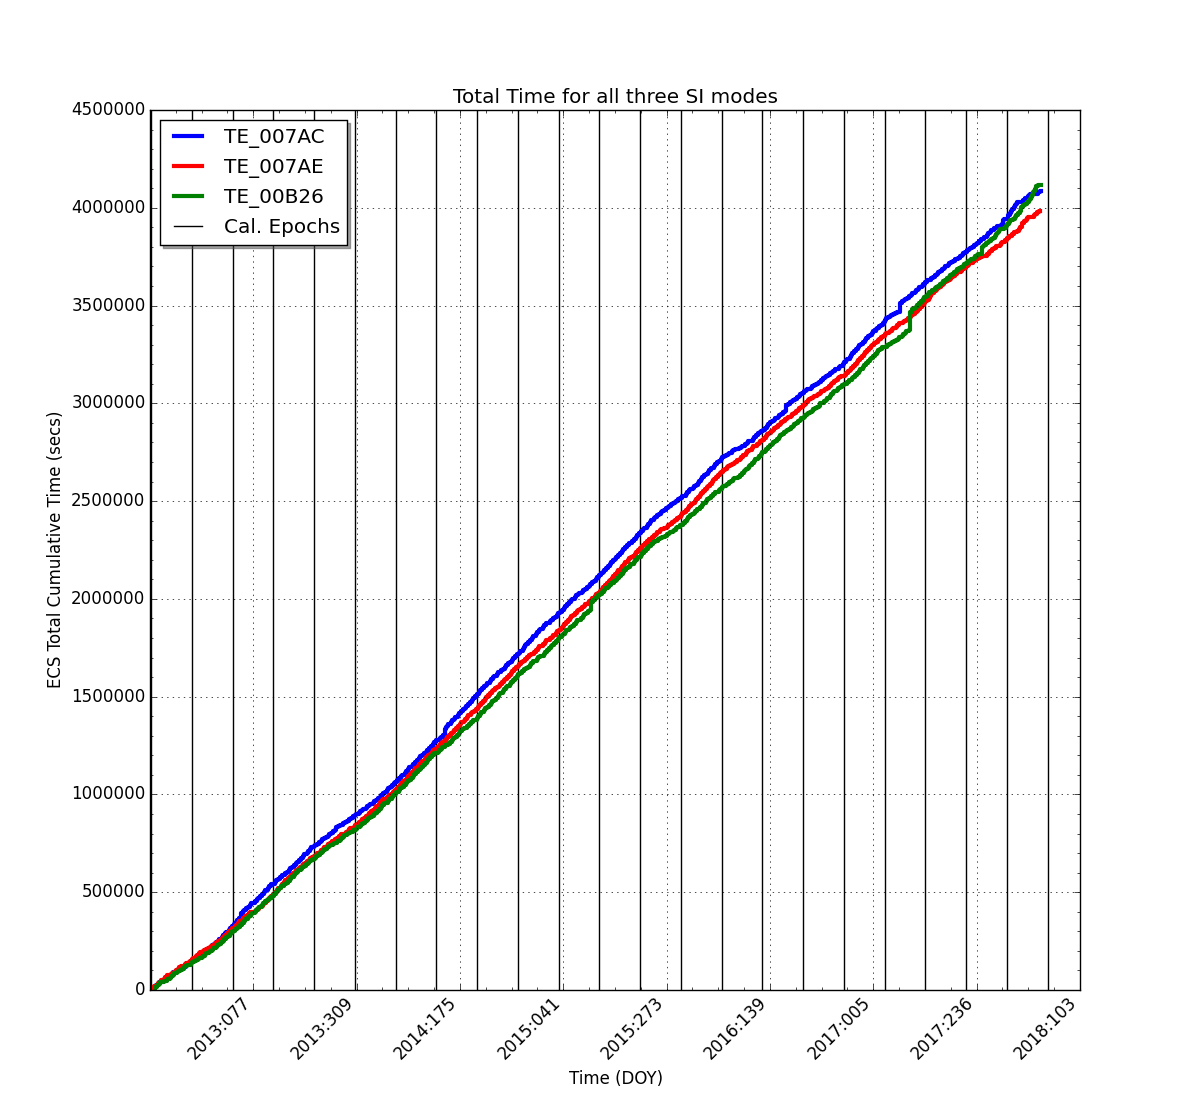
| Total Expected Time (secs) | 3731600 | 3693600 | 3716400 |
| Total Actual Time (secs) | 4087524 | 3983214 | 4115126 |
| Delta From Expected (secs) | 355924.52 | 289614.04 | 398726.65 |
| % of Expected Total (secs) | 109.54% | 107.84% | 110.73% |
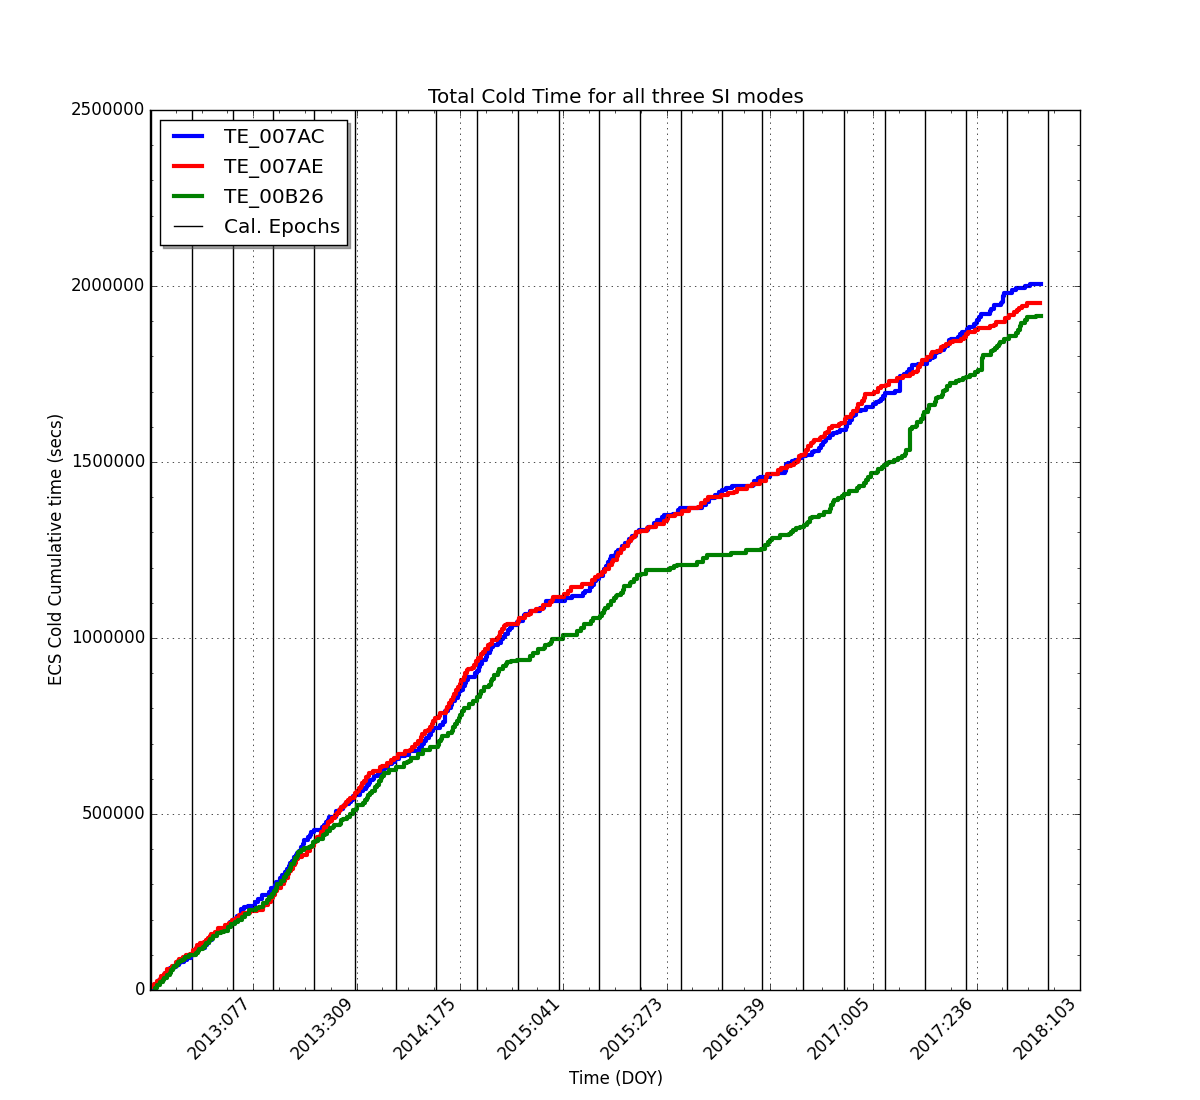
| Stats | TE_007AC | TE_007AE | TE_00B26 |
|---|---|---|---|
| Total Exp. Cold Time (secs) | 2238960.0 | 2216160.0 | 2229840.0 |
| Total Actual Cold Time (secs) | 2005556 | 1952425 | 1913377 |
| Delta From Expected (secs) | -233403.63 | -263734.25 | -316462.40 |
| % of Exp. Cold Total (secs) | 89.58% | 88.10% | 85.81% |
| SI Mode | Total Number of Obs. | Total Exposure Time (sec) | Average Exposure (sec/obs) | |
|---|---|---|---|---|
| Primary 6 Chip SI Modes | TE_007AC | 484 | 3991966.52 | 8247.86 |
| TE_007AE | 479 | 3924968.04 | 8194.09 | |
| TE_00B26 | 481 | 3940747.93 | 8192.82 | Old 6 Chip SI Modes | TE_00216 | 5 | 478338.25 | 95667.65 |
| TE_0021C | 0 | 0.00 | 0.00 | |
| TE_008EA | 0 | 0.00 | 0.00 | 5 Chip SI Modes | TE_00C60 | 12 | 102410.00 | 8534.17 |
| TE_00CA8 | 7 | 58246.00 | 8320.86 | 4 Chip SI Modes | TE_00C62 | 3 | 167526.73 | 55842.24 |
A word about the COLD Time stats:
- The Total Expected Cold Time value in the table below is 60.0% of the Total Expected Time (see Table above).
- Total Actual Cold Time is the sum of all time during each measurement where the temperature was <= -118.7 degrees C
- % of Expected Total is the fraction of the Total Expected Time achieved
SI Mode Mapping between 6,5 and 4 chip modes:
The 6 chip SI Modes consist of three distinct modes. But there are only 2, 5 chip SI Modes and only one 4 chip SI mode. To make tracking feasible, the 4 and 5 chip modes were mapped into the 6 chip modes in the following manner:
6 chip 5 chip 4 chip
TE_007AC -> TE_00C60 TE_00C62
TE_00B26 -> TE_00C60 TE_00C62
TE_007AE -> TE_00CA8
All of the TE_00CA8s get counted as TE_007AE
Half of the TE_00C60s get counted towards TE_007AC and the other half get counted with the TE_00B26s
Half of the TE_00C62s get counted towards TE_007AC and the other half get counted with the TE_00B26s.
So watchout for TE_00B26 over-representation.
Back To Top