

|
|
|
The table below has links to plots for the ACIS-I chips and ACIS-S chips for each of three date ranges. The ObsIDs which were summed are indicated in the last column. See below for a description of the images.
| Dates | Link | Summed ObsIDs | |
|---|---|---|---|
| 2002-09 to 2005-06 | ACIS-I | ACIS-S | 62850, 62848, 62846, 62836, 62831 |
| 2005-11 to 2008-11 | ACIS-I | ACIS-S | 62824, 62823, 62819, 62816, 62815, 62814, 62813 |
| 2009-06 to 2011-11 | ACIS-I | ACIS-S | 62812, 62811, 62810, 62809, 62808, 62804, 62802 |
The ACIS "Stowed" background is taken with the detector offset so that the HRC-I detector is 75 mm from the optical axis of the telescope. In this position, ACIS is shielded from the X-rays imaged through the telescope and is also far from the on-board radioactive sources used for ACIS calibration. The ACIS Stowed datasets were taken as 50ks observations at approximately 6 month intervals from late 2002 through late 2011.
These data provide a baseline background from particle interactions in the detector and fluorescent X-ray emission resulting from particle interaction with the detector and its surroundings. When ACIS is in the focal plane, it will see in addition the imaged background from the sky.
ACIS can run with a maximum of 6 chips on simultaneously. For these observations, the ACIS-I chips I0, I2, and I3 were on, as well as the ACIS-S S1, S2, and S3 chips. S1 and S3 are back-illuminated (BI) devices, and the rest are front-illuminated (FI) devices. The BI devices have very different responses and backgrounds than the FI devices. In each case ACIS was run in the normal imaging Timed Event (TE) Very Faint (VF) mode. In the reduction, all of the usual filtering and gain corrections were applied.ACIS "stowed" data are available from the CALDB. Currently, data are available for 2002-12 to 2005-09 (ObsIDs 62850, 62848, 62846, 62836, 62831, 62824, 62823, 62819, 62816, 62815, 62814, 62813, 62812, 62811), for 2005-09 to 2009-09 (ObsIDs 62824, 62823, 62819, 62816, 62815, 62814, 62813, 62812, 62811), and for 2009-09 to present (ObsIDs 62810, 62809 62808, 62804, 62802). In the following analysis, a different selection of ObsIDs was used, as indicated in the tables above Summed ObsIDs column in the tables above.
To examine the spatial nonuniformity of the ACIS "Stowed" background, the event lists were filtered on CCD_ID and energy range, and binned 16x16 pixels. The analysis was performed with FAINT mode filtering and VFAINT filtering. The energy ranges considered were 0.3-0.5 keV, 0.3-0.7 keV, 0.7-1.0 keV, 1.0-2.0 keV, 2.0-5.0 keV, 5.0-8.0 keV, 8.0-10.0 keV, and 10.0-12.0 keV.
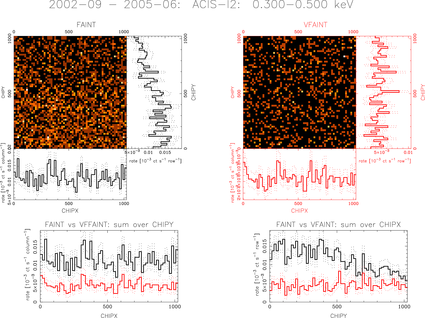
Multipanel plots were generated as in this example (click on the image to get the PDF). The top line indicates the date range, the chip ID, and the energy range.
|
For the images in the upper left and upper right, marginalizations are appended to the right and bottom sides; the sum along rows is shown to the right, and the sum along columns is shown along the bottom. The histograms for the case of no VF filtering are in black, and the histograms with VF filtering are in red. The side and bottom projections are autoscaled (zero suppressed) to make subtle variations more evident. In each case, the faint dotted lines show the √N uncertainties.
To facilitate comparing the effects of no VF filtering and VF filtering more directly, the panels at the bottom of the plot show the row sum (bottom left) and column sum (bottom right), again with with VF filtered data in red and no VF filtering in black. These are plotted on the same scale (extending down to zero) to allow an absolute comparison of the two cases.
In general, applying VF filtering reduces the amplitude of the background, and usually reduces the gradients and variation across the chip. The FI chips show relatively similar behavior, but the BI chips (particularly ACIS-S1) show larger nonuniformities, particularly at low energies and with no VF filtering.
| [Back to Home Page] | |
|
Page last modified on: 2014 Feb 26
|
Comments to: cxccal (at) cfa.harvard.edu |
|
The Chandra X-Ray
Center (CXC) is operated for NASA by the Smithsonian Astrophysical Observatory. 60 Garden Street, Cambridge, MA 02138 USA. Email: cxcweb@head.cfa.harvard.edu Smithsonian Institution, Copyright © 1998-2014. All rights reserved. |