


|

|
This memo summarizes the measurements of the spatial and time dependence of the effective contamination optical depth for the L-complex in the ECS spectrum. The developed model results in < 5% uncertainties in the contamination corrections of the effective area at 0.6-0.7 keV and < 3% uncertainties at higher energies across both ACIS-S and ACIS-I arrays.
This memo is an updated report concerning the reduction in the ACIS low energy QE caused by contamination on the Optical Blocking Filter. Below we summarize the results of our investigation into this problem and provide observers with advice and in their spectral analysis of ACIS data. The results presented here represent the combined efforts of many groups, including, the CXC, the IPI teams at PSU and MIT, and Project Science at MSFC.
Previous version: 11/19/2003
An examination of archived astronomical observations and data acquired
from the on-board ACIS calibration source (55Fe) shows that
there has been a continuous
degradation in the ACIS QE since launch. Our best interpretation is
that this is due
to molecular contamination building up on the cold optical blocking
filter,
and/or the CCD chips. This degradation is the most severe at energies
below 1 keV. At 1 keV, the degradation is approximately 10% at present;
it becomes negligible above 2 keV.
The contamination rate is well constrained by periodic observations
of the L-complex in the on-board calibration source. These data
indicate the fast build-up soon after launch and a gradual decrease in
the deposition rate later in the mission. The chemical composition of
the contaminant was established from observations of the continuum
sources (mostly Mkn 421 and PKS2155-304) with LETG. These measurements
indicate that attenuation is caused mostly by photoelectric absorption
on Carbon with a smaller contribution from Oxygen and Florine. A
detailed report on the chemical composition measurements is given by
Marshall et al. (astro-ph/0308332;
see also Herman's
page). We have developed a model that adequately describes the
time dependence of the contamination and its absorption spectrum at all
useful energies. This model is provided to the general user in the CALDB 2.26
release. The residual uncertainties in the contamination modeling in the central
region of the ACIS-S array should be of order 10% in the 0.3-0.4 keV
range and 5% level or less at other energies.
Caveat - Contamination is not uniform within both
ACIS-I and ACIS-S arrays. The current calibration is strictly valid
only for the central region of ACIS-S. Additional contamination
is observed towards the edges of the arrays. The additional optical
depth near 700 eV can be as large as 0.3-0.5 for the observations
in 2003. The spatial dependence of the contaminant is being
incorporated in the Chandra data analysis system and will be released
in the near future.
The first indication that there were problems with the low energy ACIS
QE was a May 2000 observation of PKS2155-304 with the LETG that showed
excess absorption near the C-K edge. A similar feature was also
observed in a LETG/ACIS-S observation of 3C273. Since an observation of
3C273 with the LETG/HRC-S did not show this feature, it was concluded
that the problem resided with ACIS.
Subsequent observations of PKS2155-304 and Mkn421 with LETG/ACIS-S
constrained the composition of the molecular
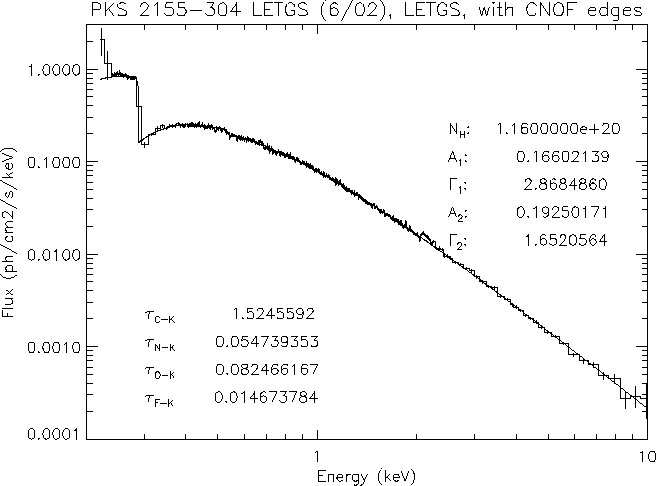
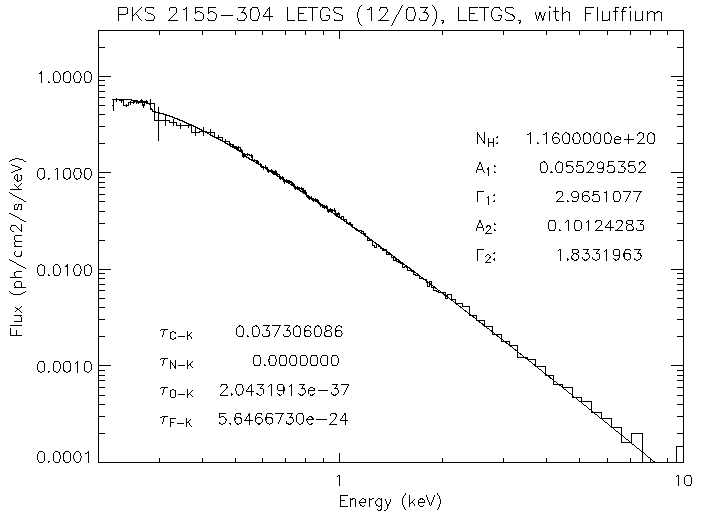
contaminant. Figure 1
shows the data for the June 2002 observation of PKS2155-304 along with
the best fit broken power-law plus edges at C,
N,O, and F. Figure 2 shows the spectral fit after the contamination model was
included in the effective area.
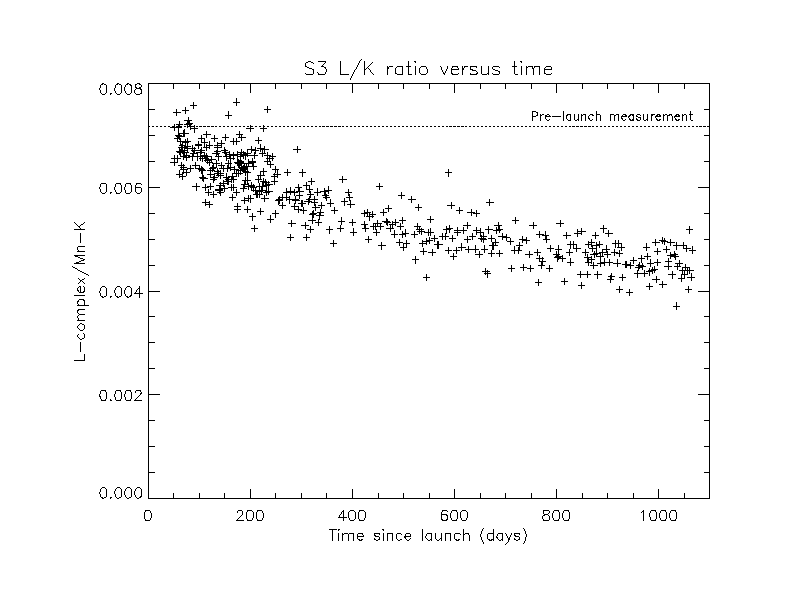
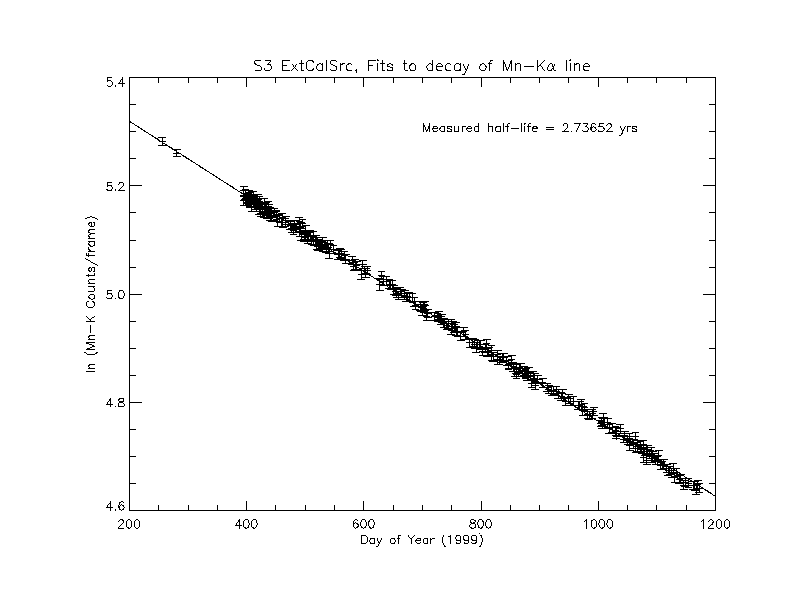
When ACIS is in the stowed position, i.e., the HRC-S is at the focal point, it is illuminated by an 55Fe source. Since the discovery that the ACIS CTI significantly increased during the first few weeks of the mission, observations of the 55Fe source have been taken before and after each perigee. Figure 3 shows that the L-complex to Mn-K alpha line ratio has continuously decreased since launch. Since the Mn-K alpha line at 5.9 keV is not affected by absorption, the decrease in the L-complex to Mn-K alpha line ratio must be due to increased opacity at the L-complex at 670 eV. Figure 3 indicates that the opacity at 670 eV is increasing at about 10% per year. To demonstrate that nothing unusual is happening to the 55Fe source, Figure 4 shows that the Mn-K alpha line intensity, produced in the 55Fe decay process, is decreasing at a rate consistent with the half-life of 55Fe.
| |
| |
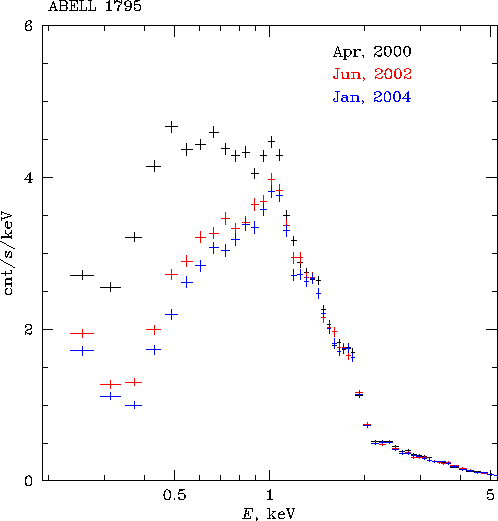
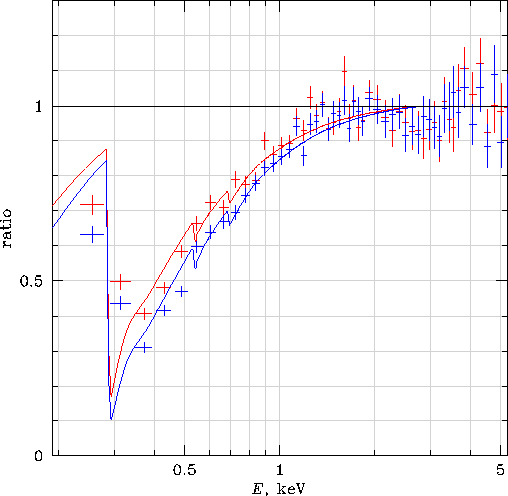
Abell 1795 was observed with ACIS-S in April 2000 and again in June 2002. A comparison of the spectra extracted from the central 1' minute region in these two observations is shown in Figure 5. Notice that there is essentially no change in the QE above 2 keV. The ratio of the two A1795 spectra is a measure of the increase in the ACIS contamination between the two epochs. This agrees well with the prediction of the contamination model (Figure 6).
| |
| |
| |
| |
Last modified: 11/15/10
 |
The Chandra X-Ray
Center (CXC) is operated for NASA by the Smithsonian Astrophysical Observatory. 60 Garden Street, Cambridge, MA 02138 USA. Email: cxcweb@head.cfa.harvard.edu Smithsonian Institution, Copyright © 1998-2004. All rights reserved. |