I have analyzed a number of ACIS sources to determine whether the PSF feature discovered in HRC data is due to imperfections in the modeling of the HRMA optics. There is considerable evidence that the feature is present in ACIS data: fits to oversampled images using customized PSFs result in residuals which show enhancements in the same direction as the location of the feature; there is a well-defined asymmetry across the data profile relative to the raytrace PSF that is consistent with the expected intensity in the feature; and comparisons of the same source observed at different rolls show that the differences are consistent with the location, direction, and magnitude of the feature.
Recently, a feature was discovered in HRC-I images of the point sources AR Lac and Capella (Juda & Karovska 2009, 2010). This feature appears as a hook about 0.8 arcsec away from the core that contains approximately 5% of the flux. It is located at the same distance and direction from the core relative to the detector geometry. If it is a HRMA optics related effect, it will be present in the same location (+Z relative to the focal plane geometry) in sources observed with different detectors. It shows up c.2003 and is present in all HRC-I point sources observed since then that have been analyzed. It persists for observations carried out over different locations on the detector. Furthermore, the shape of the feature is not indicative of the typical shape expected from degap errors in the HRC-I; that would have led to a radial spoke-like shape because the same errors would exist for all events regardless of radial distance, and the shape discovered here is essentially perpendicular to that, hooking down in a counterclockward location relative to the +Z axis and sweeping across it. Margarita Karovska carried out deconvolutions of some low-countrate ACIS sources (ObsIDs 637, 5428, and 2737, each with approximately 500 counts) and found features that matched the HRC-I deconvolutions (Karovska 2010). It is therefore plausible that the feature is not limited to HRC observations but could be due to imperfections in the modeling of the HRMA optics.
In order to test whether the observed PSF feature is real (in the sense of it not being simply an artifact in the HRC), I analyzed a number of sources observed with ACIS. I have avoided using deconvolution as a method, partly to provide an independent assessment of the data, and partly because of the fundamental limitations of deconvolution algorithms (they do not present a unique solution, and the results are often affected by the adopted stopping rule). The manner in which these sources were selected for analysis is described below. Model PSFs were created and fit to these sources; features in the residuals are consistent with the distance and directions that the feature is expected. I also searched for sources that were observed at different roll angles, so that differences between them could be used to establish the existence of the feature. Definite proof that the feature is real has not been found, but there is considerable circumstantial evidence that it exists in ACIS data also.
There are many difficulties with using ACIS data to detect a weak feature close to the core:
Given these constraints, I searched the Chandra Source Catalog for point-like sources with count rates <0.1 ct/s, but with >5000 counts, at off-axis angles <0.5 arcmin, observed since 2004. This yielded only 3 sources --
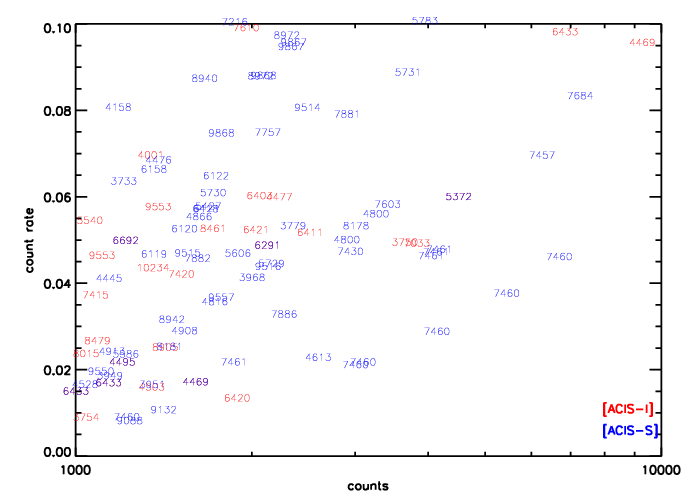
If we extend the search to weaker sources (1000 counts) at larger offaxis angles (<1 arcmin), the search yields 95 potential targets (see Appendix below). Many of these are not viable for detailed analysis because of known pre-existing or extended structures. Below I report on the results of analyzing approximately 15 of these sources which were judged to be relatively clean. They are a mix of low countrate and high counts sources. The former are necessarily limited by their statistical quality, while the latter are subject to higher systematic errors due to pileup effects.
The sources listed in Table 1 were analyzed for tell-tale features in residuals after raytraced PSFs were fit to the data. The ObsIDs were first reprocessed with chandra_repro, and a postage stamp around the interesting source was cut out and binned at high resolution. Spectra, and corresponding ARFs and RMFs, were extracted for these sources, and single-component absorbed thermal or absorbed power-law models were fit to them as appropriate. The best-fit model spectrum was used to generate a model PSF at the corresponding off-axis and azimuthal location using SAOTrace. The rays thus generated were folded through MARX and binned into an image at the same scale as the data, and were further boxcar smoothed with a (2x2) kernel to account for ACIS pixelization. The data images were then fit, using the raytraced PSFs, to a compound 2D Gaussian and a flat constant representing background contributions. The fits were carried out in Sherpa, with the raytrace PSFs acting as kernels. The 2D Gaussian component was assumed to be symmetric. The fitting process itself is carried out in such a way as to minimize the effect of pileup effects in the core. The area surrounding the point source is first fit to determine the background level, and then the wings of the source are fit to get the best-fit model parameters. Best-fit Gaussian FWHMs are typically ~0.1 arcsec, consistent with the estimated aspect reconstruction error. In all cases, similar features are present in the residuals (see below): the core is usually not well fit, and the data are in deficit to the raytrace PSF in a ring between 0.4-0.8 arcsec, and in excess in a ring outside of 0.8 arcsec. In addition, invariably there is a blob of excess data relative to the model PSF in the same direction as the expected feature, at the expected distance.
| ObsID | Object | Count Rate [ct/s] | Counts [ct] | offaxis [arcmin] | azimuth [deg] | Comments |
|---|---|---|---|---|---|---|
| 4469 | tau CMa | 0.095 | 9291 | 0.359 | 30.09 | [I] ; eclipsing beta Lyr type binary |
| 4469 | 2MASS J07184525-2456439 | 0.016 | 1605 | 0.640 | 137.55 | [I] ; Young stellar object |
| 6119 | HD 179949 | 0.046 | 1363 | 0.264 | 18.08 | [S] ; F8 type star |
| 7033 | HD 15558 | 0.048 | 3830 | 0.288 | 22.85 | [I] ; O type spectroscopic binary |
| 7457 | RS Oph | 0.069 | 6265 | 0.295 | 326.23 | [S] ; recurrent nova, the +Z axis may aligned with a jet |
| 7460 | CGKB B | 0.02 | 3010 | 0.984 | 3.43 | [S] ; LMXB in NGC 6397, observed twice at different rolls |
| 7461 | CGKB B | 0.02 | 1866 | 0.822 | 15.35 | [S] ; LMXB in NGC 6397, observed twice at different rolls |
| 7684 | APM 08279+5255 | 0.083 | 7275 | 0.308 | 326.53 | [S] ; QSO, residuals show a lot of structure, looks bar like; excluded from panda comparison figure. |
| 7882 | 4C+65.15 | 0.045 | 1618 | 0.291 | 328.55 | [S] ; QSO |
| 7886 | 3C 353 | 0.032 | 2272 | 0.296 | 330.91 | [S] ; Radio galaxy |
| 8905 | HD 97484 | 0.024 | 1425 | 0.483 | 343.02 | [I] ; Algol type eclipsing binary |
| 9088 | PSR B1957+20 | 0.0074 | 1240 | 0.285 | 325.96 | [S] ; millisecond pulsar with brown dwarf companion |
| 9132 | NGC 6626 | 0.00995 | 1416 | 0.940 | 319.40 | [S] ; X-ray source in globular cluster NGC 6626 |
| 9516 | J024634.1-082536 | 0.043 | 2134 | 0.287 | 329.12 | [S] ; QSO, nearby contaminating source @90deg anticlock, excluded from panda comparison figure. |
| 9550 | NGC 855 | 0.019 | 1107 | 0.365 | 317.77 | [S] ; galaxy |
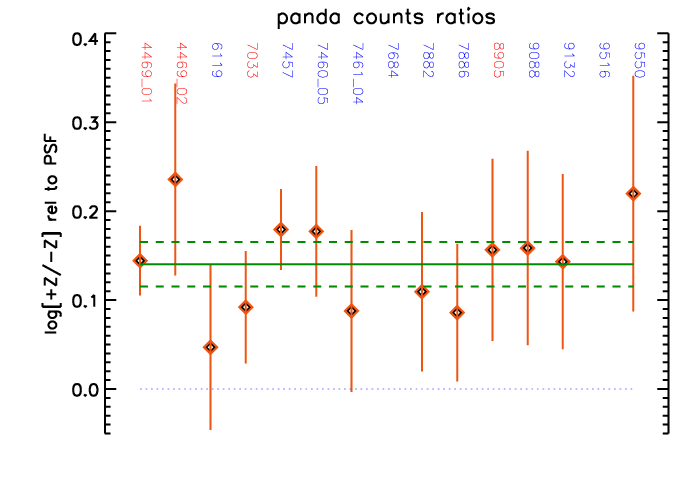
The persistence of the blob feature in the residuals suggests that the counts in the data are distributed asymmetrically relative to the raytrace PSF, and that this asymmetry is roughly aligned along the +Z axis. In order to verify this, counts in a so-called panda region, constructed from 60 degree wide annuli, centered on the +Z and -Z directions and covering radii from 0.5 to 1 arcsec, were measured for both the data and the corresponding raytrace PSFs. The results are shown in the Figure of the relative counts ratios below. A value of 0 in this scale represents a perfect match of the data to the raytrace PSF, and positive values indicate an asymmetry in the profile of the data biased towards the +Z direction. As expected, there is a consistent excess in the +Z direction relative to the -Z. Monte Carlo simulations of values generated independently for each case, distributed as a Normal with appropriate mean and variance, show that the excess is negative in 10% of the cases. Thus, the estimated probability that the excess is positive is 0.9 . The average excess, assuming that it is the same in all cases, is 0.14 +- 0.025. This is consistent with the expected strength of the feature. Each of the panda segments contain approx 8% of the total strength of the source (the annulus between 0.5 and 1 arcsec contains ~45% of the total flux), and the excess measured here is relative to this fraction. Given that the PSF would spread out approximately half the counts in the feature outside the panda regions too, the measured nominal excess of ~1.38 implies that the strength of the feature is 5.7% +- 1%. [Note: a previous version of this memo reported the uncertainty as higher, as 0.14+-0.1; this was an estimate of the overall width of the distribution, and not the accuracy with which the average can be estimated, the latter which is what is now quoted above.]
Figure: Asymmetry in the counts in the data along
+Z compared to counts along -Z.
The ordinate is the log of the ratio of the counts in the direction
of the feature to the counts in the antidirection, normalized to the model PSF.
The measured excess is shown (diamonds) for each of the ObsIDs (excluding
those where source structure interferes with the analysis) along with
1-sigma error bars (vertical bars). The data points are labeled with
the corresponding ObsIDs, which are given in blue for ACIS-S observations
and in red for ACIS-I observations. The zero point, which indicates a
data profile that matches the model PSF perfectly, is shown as a blue dotted
line. The green horizontal lines show the average excess (solid) and
1-sigma error bars on it (dashed). The average excess is consistent
with a feature of 5% intensity.

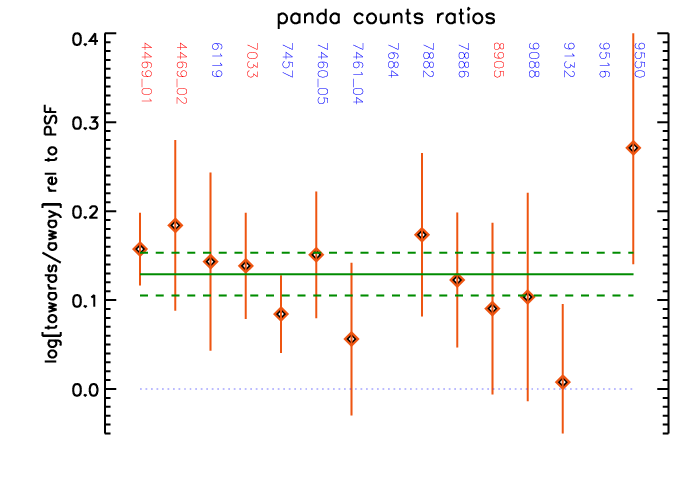
Deconvolution studies by M. Karovska suggest that the feature is not aligned exactly with the +Z axis, but is displaced in an anticlockwise direction by approximately 15 degrees. Repeating the above analysis with such slightly displaced panda regions gives essentially the same results. The average relative excess towards the feature is 0.13 +- 0.025. This is again consistent with the expected strength of the feature. The measured nominal excess of ~1.35 implies that the strength of the feature is 5% +- 1%.
Figure: As above, but
with the regions aligned along the most probable direction of the feature,
which is 15 degrees anticlockwise from +Z.
The sources analyzed thus far, and the residuals of the 2D fit, are shown below. The image on the left (in log grayscale) shows the source in the 0.3-7 keV band binned at 1/8 pixel and the image on the right (histogram equalized colormap A) depicts the residuals after fitting a symmetric constant+gaussian2D model to the data. Overlaid on both is a circle of radius 0.8 arcsec (cyan), which represents the distance of the hook from the core of the PSF as found in deconvolutions of HRC images, and a vector (red) pointing in the +Z direction (see Appendix).
Figure: ObsID 4469, tau CMa.

Figure: ObsID 4469, a YSO near
tau CMa, in the same dataset. Though weaker,
it shows the same type of structure in the residuals, with an
enhancement towards the +Z direction.
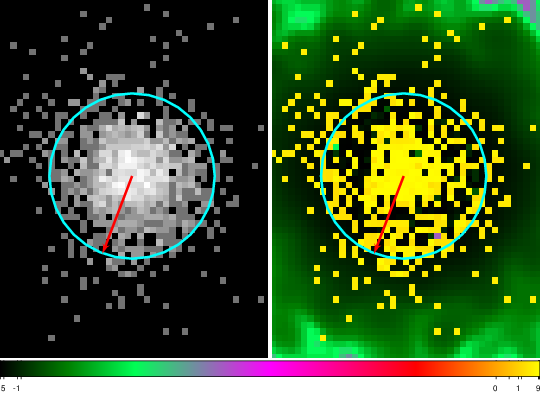
Figure: ObsID 6119, HD 179949. The
tell-tale blob structure in the residuals is not as prominent,
but there is a clear asymmetry in the spatial extent towards
+Z.
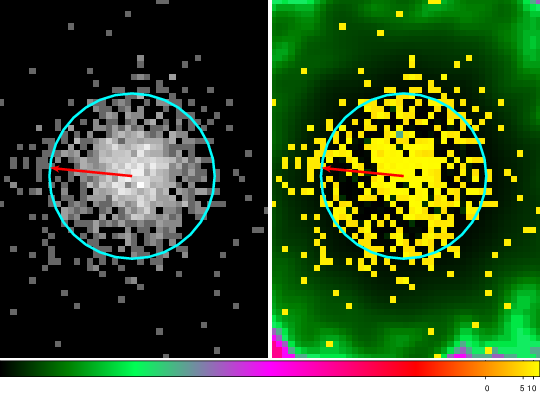
Figure: ObsID 7033, HD 15558. The structure
in the residuals sweeps from +Z counterclockwise. This is
reminiscent of the prominent "hook" appearing in deconvolved HRC images
in observations in 2006 and 2007.

Figure: ObsID 7457, RS Oph. An extension in the
image was identified with a jet by Luna et al. (2009).
The orientation is similar to that expected from NIR data, and there
are bright radio spots in the anti-direction (see their Fig 4), suggesting that the
current feature is lined up with a possible jet. However, given all
the other analyses done here, it appears likely that the apparent
match is simply coincidental.
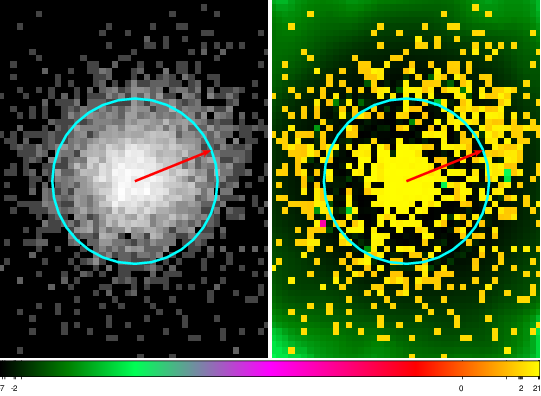
Figure: ObsID 7460, LMXB in NGC 6397. This, and the
companion observation, are of the same source, on
the same detector, at different roll angles. They both exhibit the same
tell-tale enhancement in the residuals, starting from the +Z direction
and sweeping counterclockwise. The differences are slight, but prominent, and
rule out intrinsic source structure as the cause of the structure in the residuals.
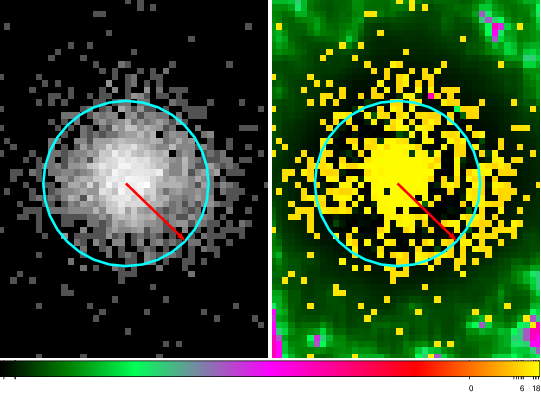
Figure: ObsID 7461, LMXB in NGC 6397, as above.
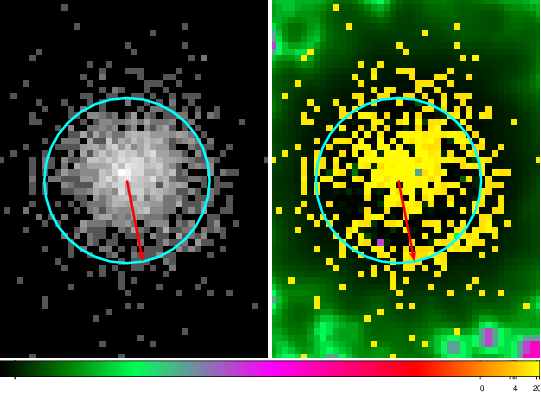
Figure: ObsID 7684, QSO 0827+525. The residuals show
the usual enhancement, and also considerable structure elsewhere near the
core, suggesting that the assumption of a structureless point source is
incorrect. This source has therefore been excluded from the panda
analysis above.
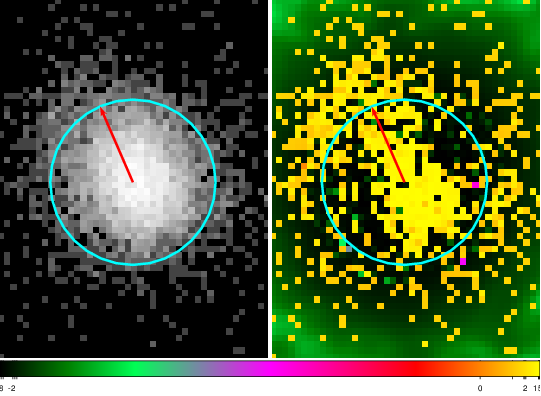
Figure: ObsID 7882, 4C+65.15, shows the
typical enhancement in the residuals.
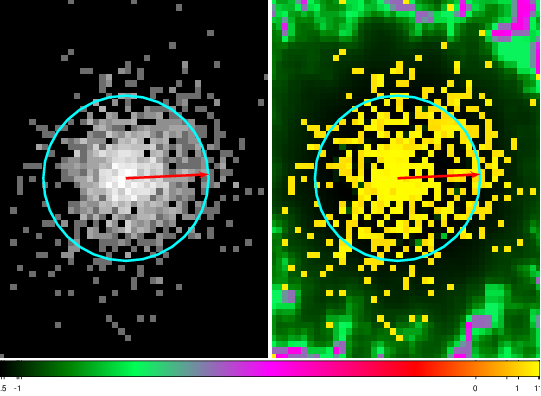
Figure: ObsID 7886, 3C 353, shows the
typical enhancement in the residuals.
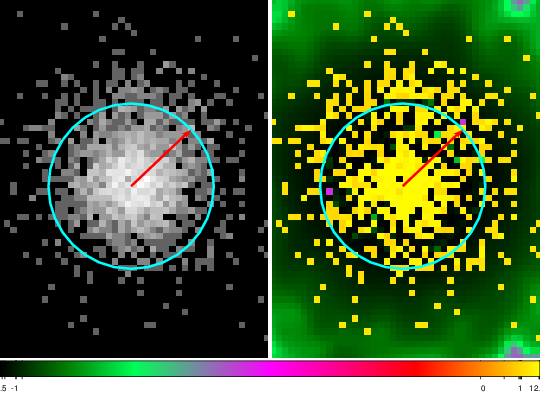
Figure: ObsID 8905, HD 97484. This is one of the
cases that demonstrates why this type of analysis with ACIS data is
difficult. The image shows the usual extension and that effect is
also seen in the residuals, but similar extensions and enhanced
residual structure is also seen in a direction 90 degrees clockwise.
This result is thus not definitive.
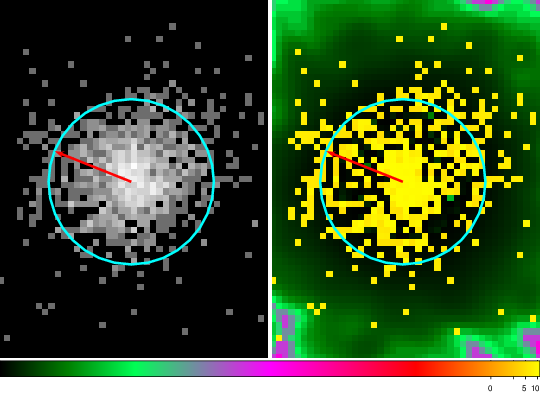
Figure: ObsID 9088, PSR B1957+20, shows the
typical enhancement in the residuals.
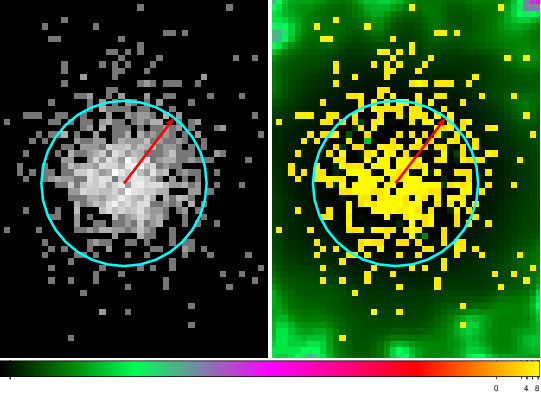
Figure: ObsID 9132, NGC 6626, shows the
typical enhancement in the residuals.

Figure: ObsID 9516, QSO J024634.1-082536.
There is a nearby source at 90 degree counter clockwise to the
+Z direction. While the source image exhibits the typical
extension in +Z, proper modeling of this region is
difficult and in fact the 2D fit did not succeed. This source
is therefore not included in the panda analysis.

Figure: ObsID 9550, NGC 855. The feature in
the residuals is weak, but the spatial extension is clear, as in
the case of HD 179949.
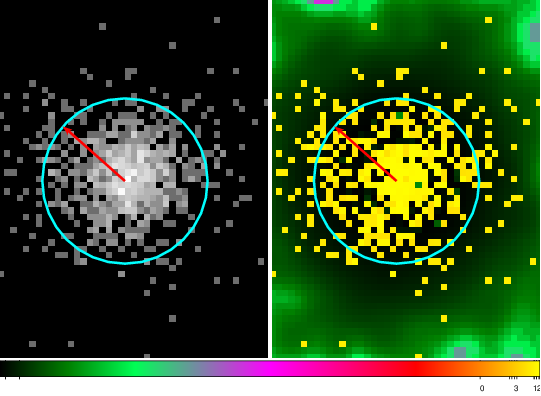
In a few cases, the same source was observed at different roll angles. If the feature we are trying to identify is due to the HRMA optics, then it will remain oriented in the same direction relative to the instrument modules. Thus, it will appear at different roll angles in the different observations. One such case is described above, with a comparison of the LMXB in NGC 6397, CGKB B, in ObsIDs 7460 and 7461. The spacecraft roll changed by 12 degrees, and the corresponding tell-tale enhancement in the residuals also shifted by a similar amount. Though showing that the residuals features are not artifacts of the analysis, this result is not definitive due to the noise in the data.
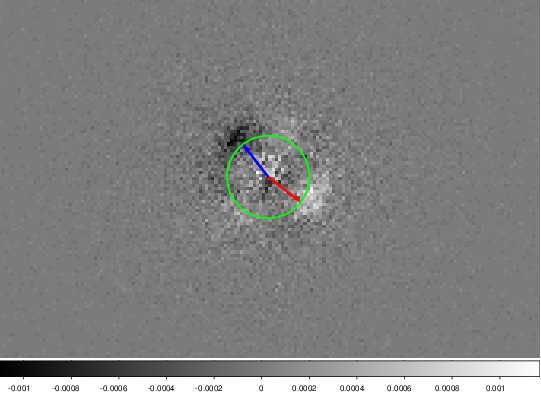
Another case of sources observed at different rolls is in two observations of M33: ObsIDs 6376 and 6377. The characteristics of the two observations are shown below in Table 2. Unfortunately, the source is heavily piled up, and it is not currently possible to generate useful raytraced PSFs to deal with this case. However, normalizing the two images and subtracting one from the other leads to a surplus and a deficit of the expected magnitude (~5%) in the expected directions (surplus along +Z of ObsID 6376, deficit along +Z of ObsID 6377) at the expected distance (~0.8 arcsec) from the core, suggesting strongly that we are witnessing the effect of the feature. But this again cannot be considered definitive proof, because at such high pileup rates, we cannot rule out CTI and grade migration related effects on the PSF and "cross-talk" between events from the feature and events from the core of the PSF (which may lead to the feature being suppressed).
| ObsID | Roll | Count Rate [ct/s] | Counts [ct] | Offaxis [arcmin] |
|---|---|---|---|---|
| 6376 | 308.47 | 0.188 | 17502 | 0.277 |
| 6377 | 142.01 | 0.166 | 15442 | 0.294 |
Figure: Images of the central source in M33,
in ObsID 6376 (left; readout streak extends towards upper right corner)
and 6377 (right; readout streak extends towards lower left corner).
Note the strong pileup-induced structure. The blobs perpendicular
to the readout streaks are enhanced in the +Z direction.
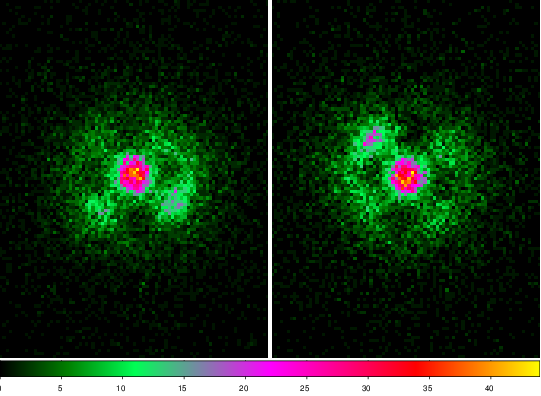
Figure: Difference of normalized images from ObsIDs 6376 and 6377.
The green circle denotes a distance of 0.8 arcsec from the core, the red arrow points
in the +Z direction of ObsID 6376, and the blue arrow points in the +Z
direction of ObsID 6377. There is considerable scatter in the difference image near
the core, as is expected due to statistical noise. There are also structures along the
readout streak directions. But most prominent are the enhancement and deficit seen as
the white and black blobs at the ends of the red and blue arrows respectively, and which
match the size, location, and direction of the expected feature.
I have analyzed a number of ACIS point sources in three different ways. First, by looking for consistent features in residuals to fits to the data; second, by measuring the asymmetry in the data profile along the Z axis, and third, by comparing the same sources observed at different roll angles. In all cases, the analyses indicate that the feature is present. The residuals show enhancements at the expected direction and the expected distance; the observed profiles are asymmetric at a significance of 90%, and the magnitude of the asymmetry is consistent with a feature at 5% of the flux; and the differences in the sources at different rolls match that which is expected. While unambiguous proof is lacking, the preponderance of the results, along with supporting deconvolutions of tau CMa by Margarita Karovska (private communication) suggest that the feature is not simply an artifact of the HRC.
Figure: HRC orientation (Figure 7.1 from the POG).
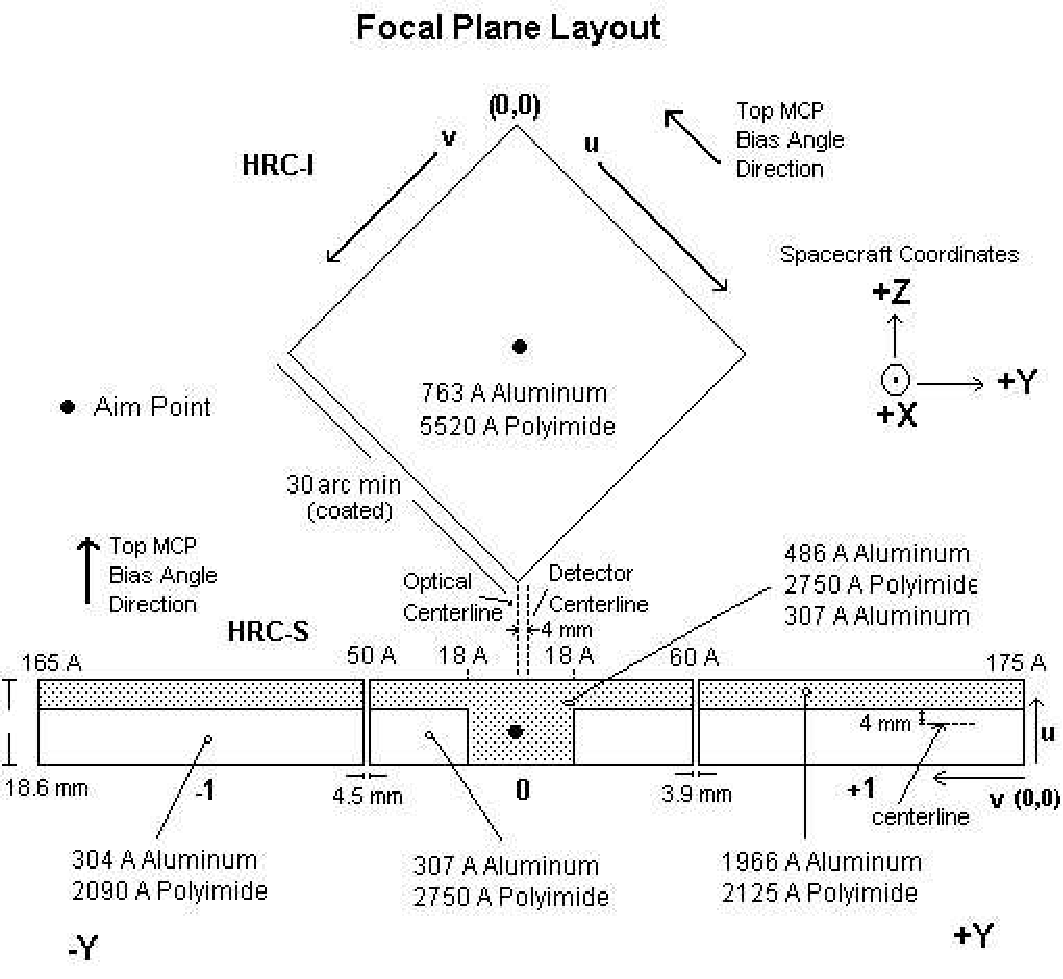
Figure: Chandra instruments layout (Figure 1.2 from the POG).

Figure: Scatter plot of counts and
countrates of candidate sources from the Chandra Source Catalog. The
locations are marked by the corresponding ObsIDs in which the
sources are present.
Sources observed with the ACIS-I are colored red and those with the ACIS-S are colored blue.
The ACIS-I is generally preferred for analysis because the expected location of the feature does not overlap with the direction of the readout streak.
The ideal source for our analysis would be an isolated point source placed to the lower right corner of the plot.
