

|
|
|
J. Posson-Brown, V. Kashyap
Jan 2009
We have tested the effect of the new HRMA EA on the HRC-I QE model. We find that all changes in the EA are compensated by changes to the source models and thus no changes are warranted to the QE.
We fit ACIS observations of Cas A and G21.5-0.9 and an ACIS/LETG observation of PKS2155-304 using ARFs made with 1) the old HRMA EA model (hrmaD1996-12-20axeffaN0007.fits), and 2) the new HRMA EA model (hrmaD1996-12-20axeffaN0008.fits). This gave us a set of source models for our calibration sources for each HRMA EA model. The model parameters for are shown in the tables below:
Source: SNR Cas A on ACIS-I
Model: absorbed power law, fit over 0.5-4 keV
| Parameter | old HRMA EA | new HRMA EA |
| nH | 1.53e22 | 1.50e22 |
| index | 3.24 | 3.22 |
| normalization | 1.80e-03 | 1.90e-03 |
Source: SNR G21.5-0.9 on ACIS-S3
Model: absorbed power law, fit over 0.9-8 keV
| Parameter | old HRMA EA | new HRMA EA |
| nH | 2.15e22 | 2.19e22 |
| index | 1.73 | 1.83 |
| normalization | 1.63e-02 | 1.93e-02 |
Source: blazar PKS 2155-304 on ACIS-S/LETG (this source is
variable, so we chose an ACIS observation that was done the same day
as our HRC-I/LETG observation)
Model: absorbed power law, fit over 0.2 - 2.5 keV, with nH
frozen
| Parameter | old HRMA EA | new HRMA EA |
| nH | 1.36e22 (frozen) | 1.36e22 (frozen) |
| index | 2.74 | 2.75 |
| normalization | 1.85e-02 | 2.03e-02 |
Next, we made two HRC-I ARFs for each source: one with the old HRMA EA model and one with the new HRMA EA model. We then convolved the source models with the HRC-I ARFs over the nominal HRC-I response range (0.06 - 10 keV) to get predicted count rates for each source with the old and new HRMA EA models. These predicted rates are shown in the table below:
Predicted HRC-I Count Rates
| Source | with old HRMA EA | with new HRMA EA |
| Cas A | 0.032 | 0.032 |
| G21.5-0.9 | 0.59 | 0.59 |
| PKS 2155-304 | 1.55 | 1.57 |
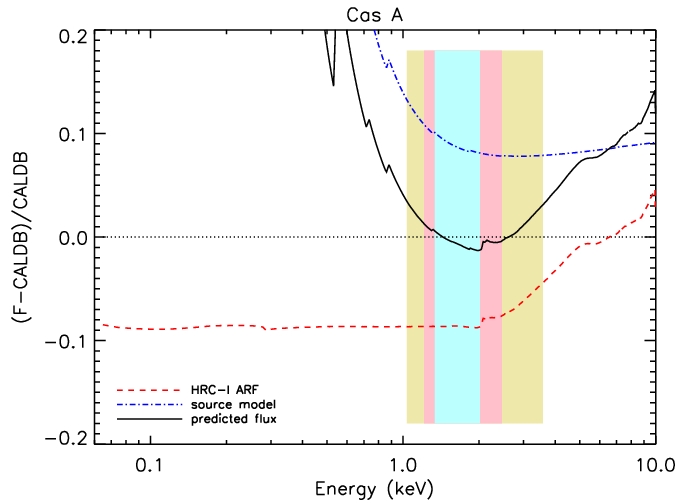
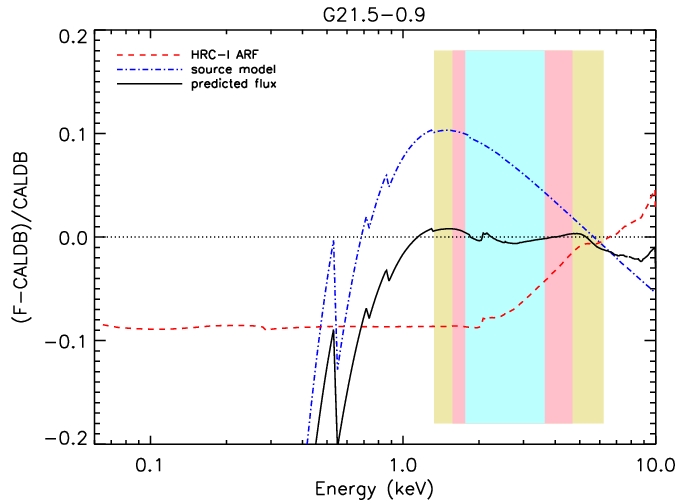
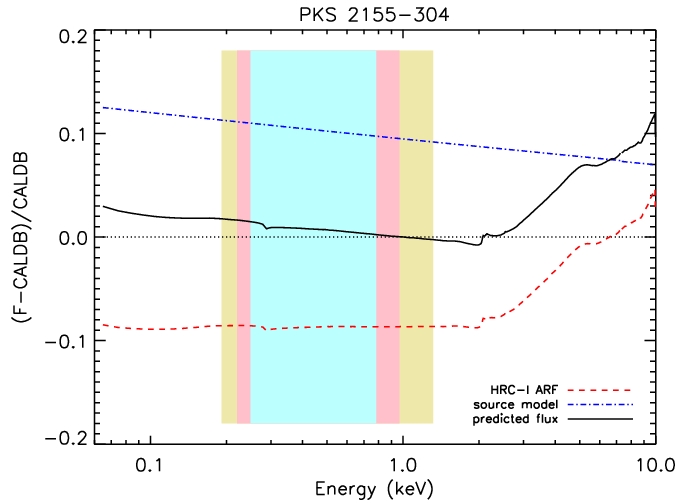
It is clear that the change to the HRMA EA does not significantly affect the predicted HRC-I count rates. This can be understood by examining the plots below. These plots show the relative difference between the HRC-I ARFs made with the two HRMA EA models (red dashed line), the source models resulting from fits with the two HRMA EA models (blue dot-dashed line), and the predicted fluxes, which is essentially the product of the previous two (solid black line). The blue, pink, and yellow regions represent the energy ranges where 50, 70, and 90% of the predicted flux is coming from. Note that within these bands, the relative differene between the predicted fluxes is close to zero.
|
The Chandra X-Ray
Center (CXC) is operated for NASA by the Smithsonian Astrophysical Observatory. 60 Garden Street, Cambridge, MA 02138 USA. Email: cxcweb@head.cfa.harvard.edu Smithsonian Institution, Copyright © 1998-2004. All rights reserved. |