The continuing gain drop on both the HRC detectors over time had caused the PHA distribution to shift until a significant portion of the events fell below the on-board lower level discriminator and were not telemetered down (see Fig G21.5 below for an illustration). Such events are lost, and the effect becomes apparent as a drop in the count rate, describable as a QE loss (see Fig HZ43 Rate showing the trend of the observed count rate of the steady calibration source HZ 43 in both HRC-I and HRC-S).
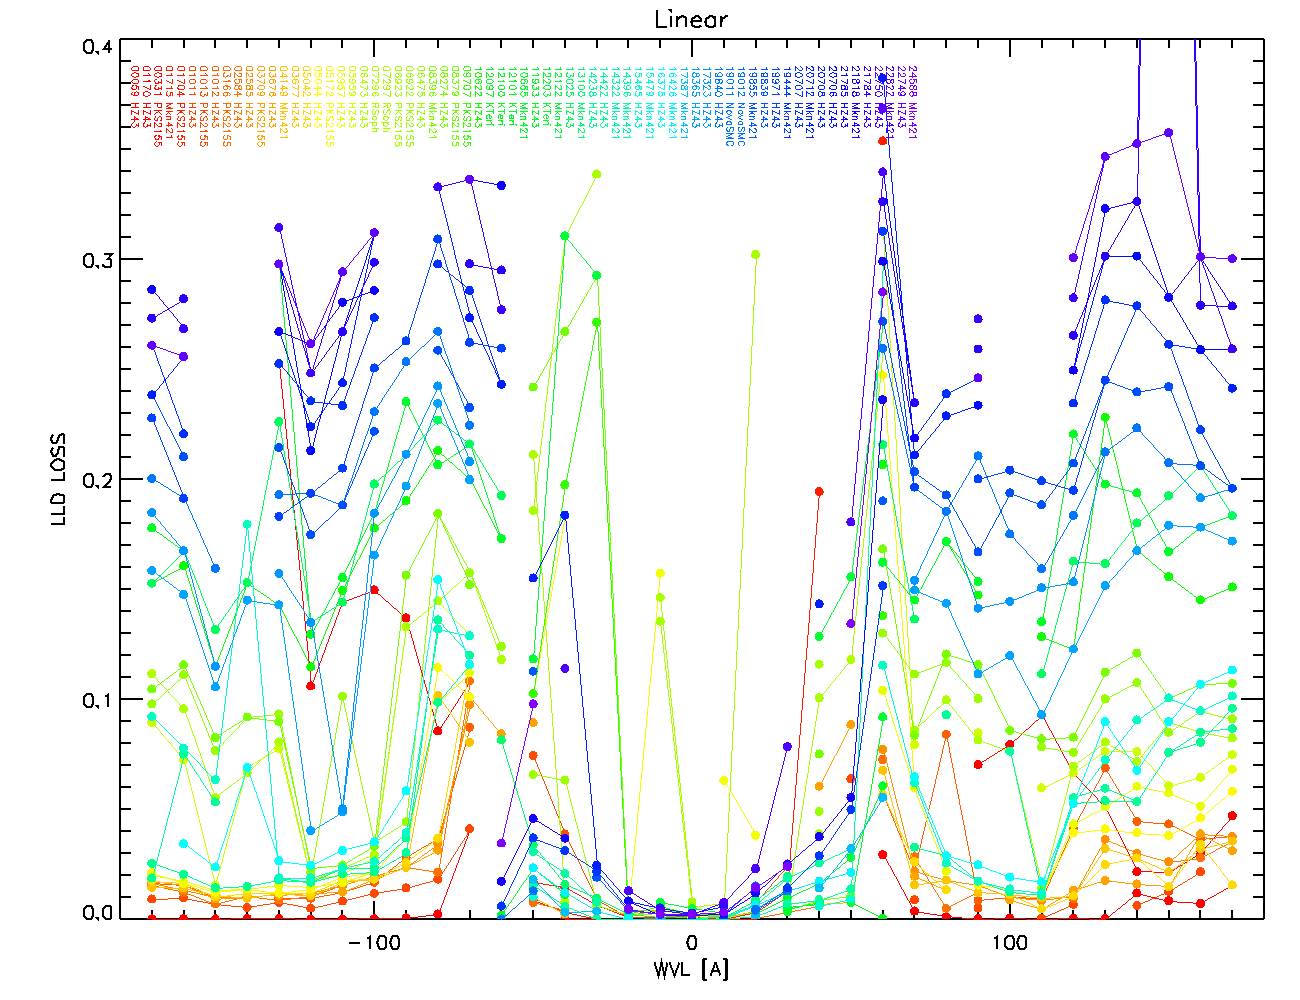
This QE loss due to gain drop has a wavelength dependence, with the longer wavelength photons preferentially affected. Compare the magnitude of the effect on the soft source Fig HZ43 with that of the harder source Fig ARLac. On HRC-I, the QE loss for HZ 43 reached 16% in early 2021, while the corresponding value for AR Lac was 9%; harder sources are less affected than softer sources (Fig Wavelength Dependence). Similarly, the effect is easily visible with dispersed events on the outer plates of the HRC-S (reaching 30% at some wavelengths), but not on the central plate (Fig Wavelength Dependence). Even so, the observed QE loss in the HRC is larger than can be accounted for by this effect (Fig Unaccounted).
The primary impact of this effect is that the measurable count rates -- and therefore the sensitivity of the instrument -- are reduced. In particular, we note that that the use of the S_TIMING mode can cause substantial loss in count rate, and observers whose science requires high-precision timing measurements should contact the Instrument or Calibration teams before proposing to use that mode.
Currently, the magnitude of this effect is mitigated by dint of the voltage having been raised on both the HRC-I and the HRC-S. However, it can still be large (~10% depending on the spectrum of the source), and as the gain drop continues, the magnitude will increase.
The full extent of the QE loss is not explained by this phenomenon. While gain is a crucial (and primary) factor in the evolution of the QE, the full mechanism by which it affects the QE is still under investigation.
During the lead up to the HRC-S voltage increase in 2012, B.Wargelin (see Figures 33 and 34; Pulse Height Filtering) showed that the low-PHA tail of the the pulse height distributions showed that they were being truncated as the gain was dropping. This is attributable to increasing numbers of events falling below the on-board lower level discriminator (LLD) and consequently discarded from the telemetry stream.
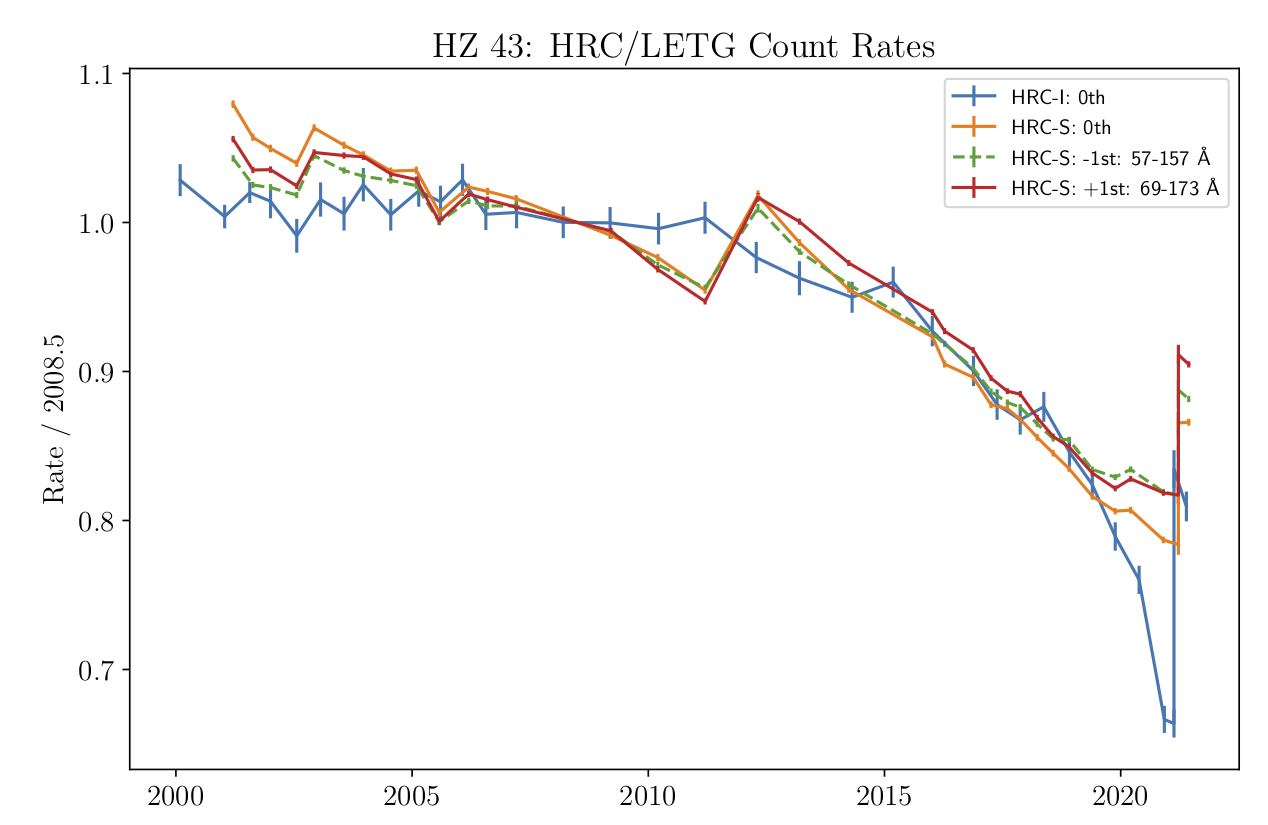
Recent HRC-I and HRC-S observations HZ 43 (a white dwarf) show that their count rates have been decreasing (see Fig HZ43 Rate below). In this memo, I establish what fraction of the count rate drop can be directly attributed to events lost below the LLD.
| Figure HZ43 Rate: Trend in observed count rates for the steady calibration source HZ 43, a white dwarf, with the LETGS+HRC-I (zeroth order: blue curve) and LETGS+HRC-S (zeroth order: orange curve; dispersed events: red and green curves). The count rates are normalized to unity at epoch 2008.5 for convenience. Notice that the HRC-S rates show a steady decline right from the start of the mission, interrupted by the voltage increas in 2012, while the HRC-I rates are steady until c.2015, after which they decline faster than the HRC-S. In both cases, the voltage increase in early 2021 has restored a significant fraction of the QE. (Plot by P.Ratzlaff) | |
In May 2020, as part of the detector QE calibration program, an observation of the plerion SNR G21.5-0.9 was carried out with the HRC-S (ObsID 22855). The observation was carried out in the S_TIMING mode (typically these observations are carried out in SCENTER mode; S_TIMING provides a workaround to the detector timing error [which causes the arrival time of a triggered event to be attached to the following event, anywhere on the detector, which may or may not be telemetered] by telemetering all triggered events). Because the S_TIMING mode sets the trigger level threshold at a higher value (21 instead of 8), this mode predominantly filters out low PHA events. Because of the gain drop experienced by the HRC-S since the beginning of the mission, this setting resulted in a catastrophic drop in the count rate. However, the observation proved to be useful to determine the effect of the trigger threshold. By comparing the distributions of the scaled sum of the amplifier signals (scaled SAMP; this is the preferred quantity to characterize signal rather than PHA because it has been shown to be more robust, see Wargelin et al. 2007, Wargelin 2009), and matching the high SAMP tails obtained from ObsIDs 22855 with a previous observation (ObsID 20657), we can estimate the event loss (Fig G21.5). The estimated loss through this shifting of the spectrum brings the flux estimate back in line with previous estimates.
| Figure G21.5: Comparing the scaled SAMP distributions of G21.5-0.9 plerion for ObsIDs 20657 (black; SCENTER) and 22855 (red; S_TIMING). The distribution from ObsID 20657 has been shifted until the high SAMP tails match. The region shown as hashed with the vertical lines represents counts lost with the higher trigger threshold used in ObsID 22855. | 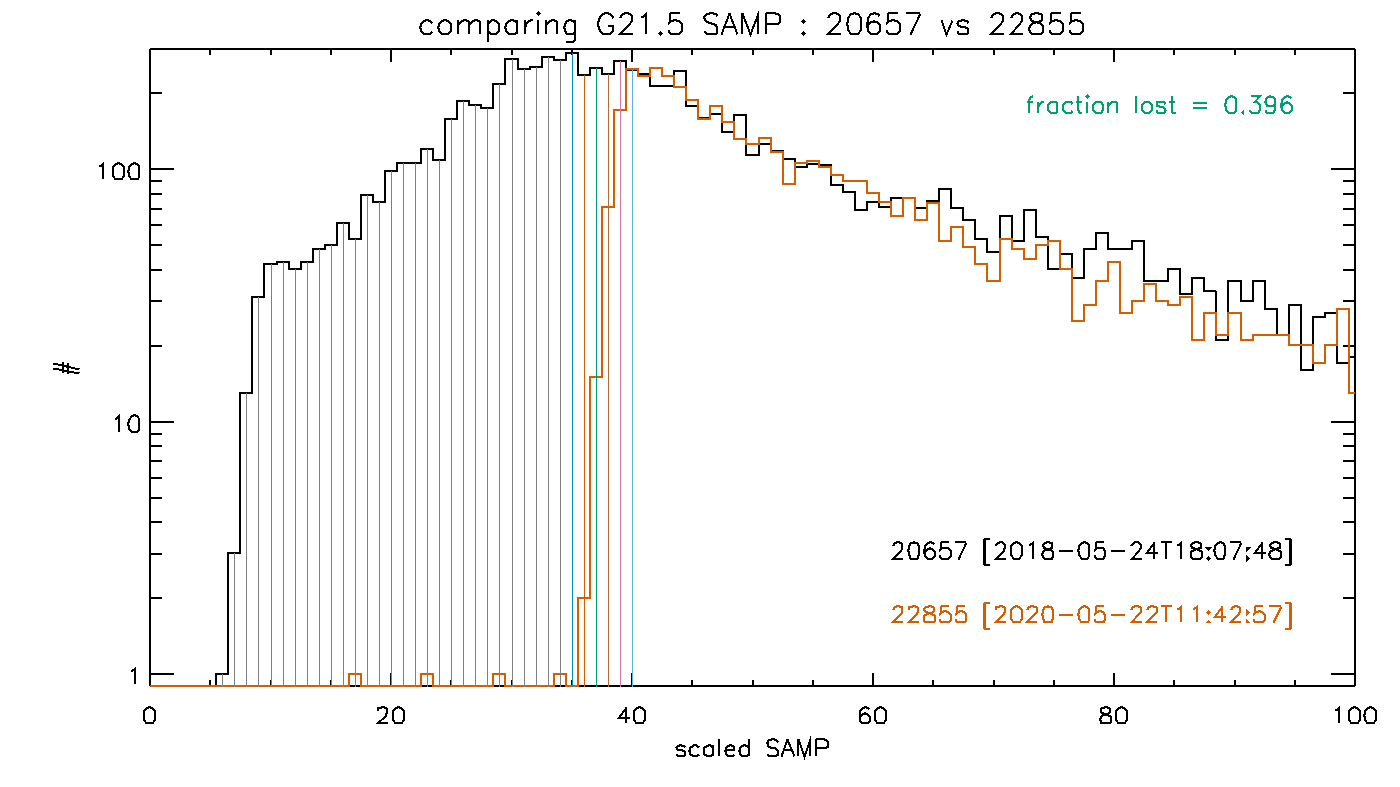 |
Here I describe a method that uses deformations in the scaled SAMP distribution (sSD) to estimate the fraction of events lost below the trigger threshold due to the drop in gain in both the HRC-I and HRC-S. The method relies on there being a standard sSD for comparison, typically a long duration observation from early in the mission. The observed sSD is compared to the standard sSD to determine the magnitude of the distortion. A proxy for for detector gain is computed that ensures that the observed sSD between percentiles 0.35 to 0.99 matches the standard sSD. The individual scaled SAMP values are then readjusted according to this correction, and the readjusted sSD is compared with the standard sSD. The excess events present in the standard sSD, relative to the readjusted sSD represents the QE loss attributable to gain loss.
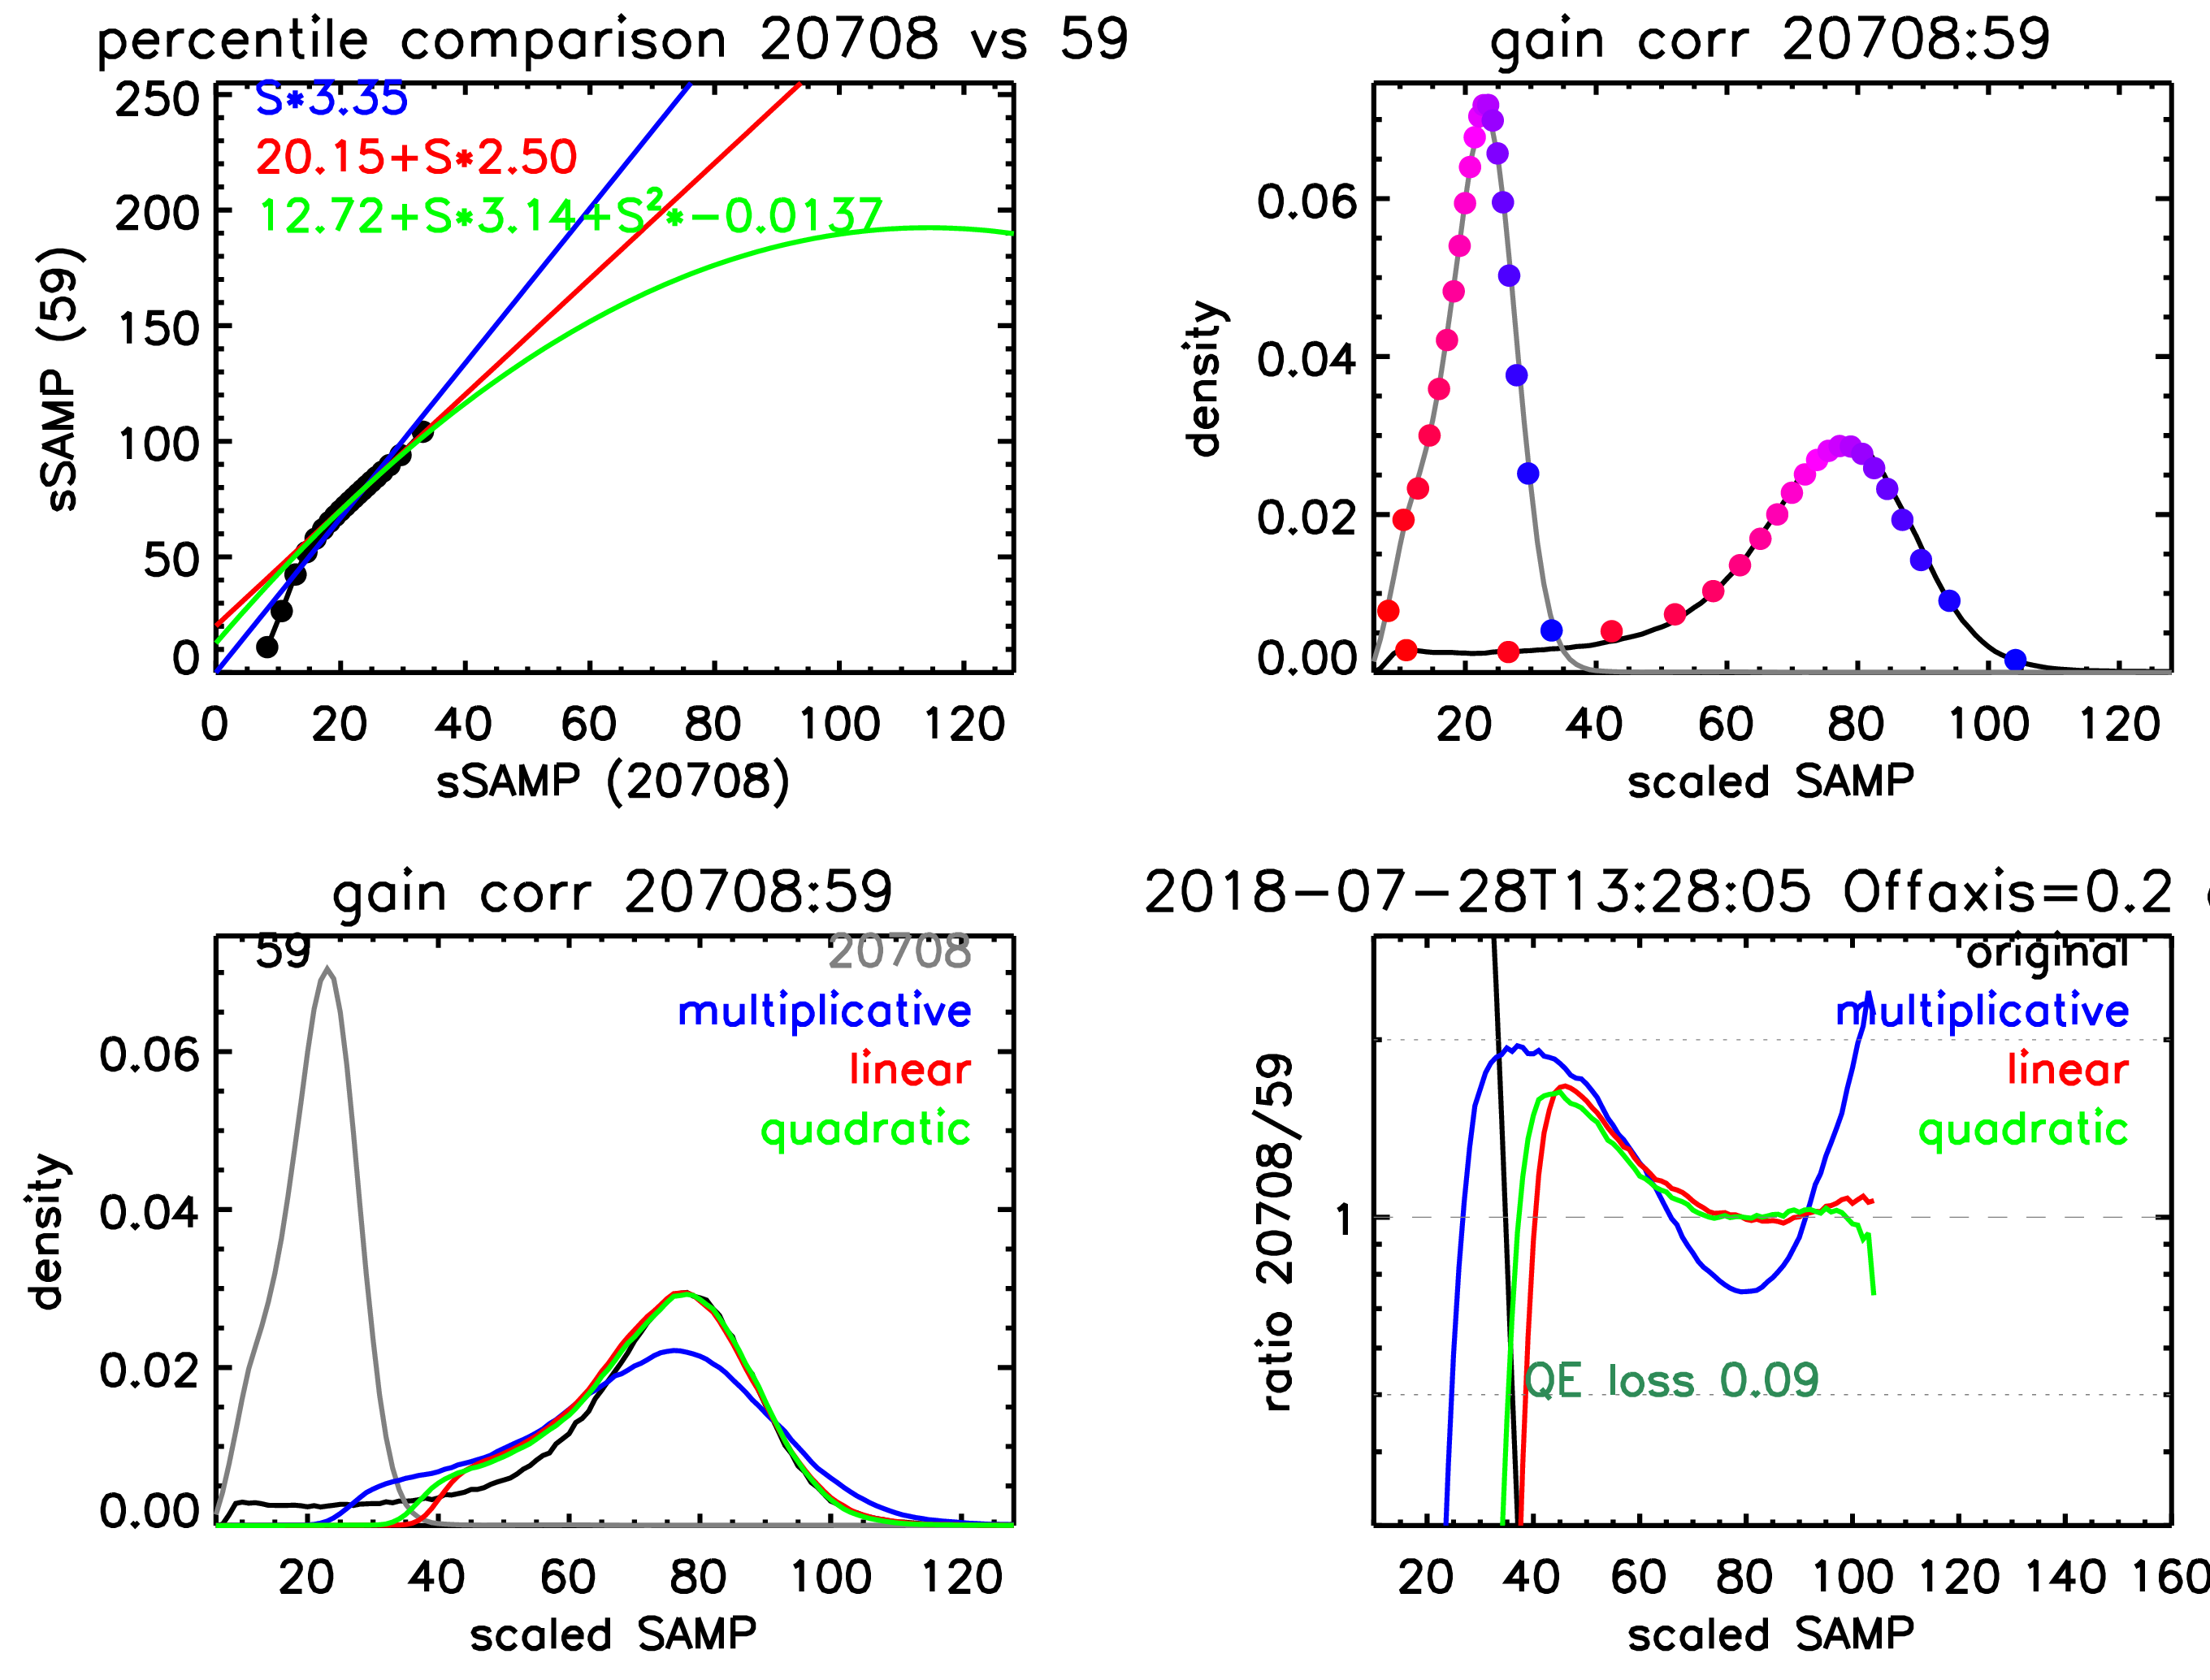
This process is illustrated in Fig Method, where the sSD from a LETGS+HRC-S zeroth-order observation of the white dwarf HZ43 (ObsID 20708) is matched to the sSD of the same object obtained early in the mission (ObsID 59). The percentiles of the sSDs are extracted and fit with different conversion factors: a constant scaling, akin to the usual gain correction implemented in CALDB and CIAO; a linear scaling; and a quadratic scaling. The constant scaling is insufficient to handle large gain drops, while the quadratic scaling occasionally causes non-linear multi-valued mapping to occur and hence requires more study. In everything that follows, we adopt the linear scaling factor.
| Figure Method: Illustrating how the QE loss attributable to gain drop is computed, using sSDs from LETGS+HRC-S zeroth-order observations of HZ43, comparing ObsID 20708 with ObsID 59.
Top Right: The scaled SAMP distributions of the two ObsIDs of interest, the current one (in this case 20708) and the target (59) are shown, with the quantiles ranging from 0.05:0.95,0.99 (dot colors going from red to blue) are shown. Top Left: The quantiles of the observed scaled SAMP distributions of the current (x-axis) is plotted against the target (y-axis), and several algebraic forms are fit over the quantile range 0.35-0.99. Multiplicative (blue), linear (red), and quadratic (green) fits are shown. The current gain calibration assumes a multiplicative factor. The quadratic correction is more capable of matching deformities in the profiles, but requires additional constraints in order to prevent multivalued corrections. We find the linear correction to be the most robust at this stage of the evolution of the gain loss. Bottom Left: Showing the effect of the gain corrections, transforming the observed scaled SAMP normalized distribution (grey curve) to match the target (black curve). The effects of applying the multiplicative (blue), linear (red), and quadratic (green) corrections are shown. In this case, the linear correction is inadequate to match the target profile, but both the linear and quadratic profiles match both the size and width of the mode and the right-hand profile. Bottom Right: The ratio of the various transformed distributions -- original (black), multiplicative (blue), linear (red), and quadratic (green) -- to the target distribution. The horizontal dotted lines indicate variations in the ratio of by factors of 2x. The value of the scaled SAMP where the ratio drops below 0.5 is used to set the cut off point, and the QE loss is estimated as the fraction of the target curve distribution to the left of the cut off point. |
|
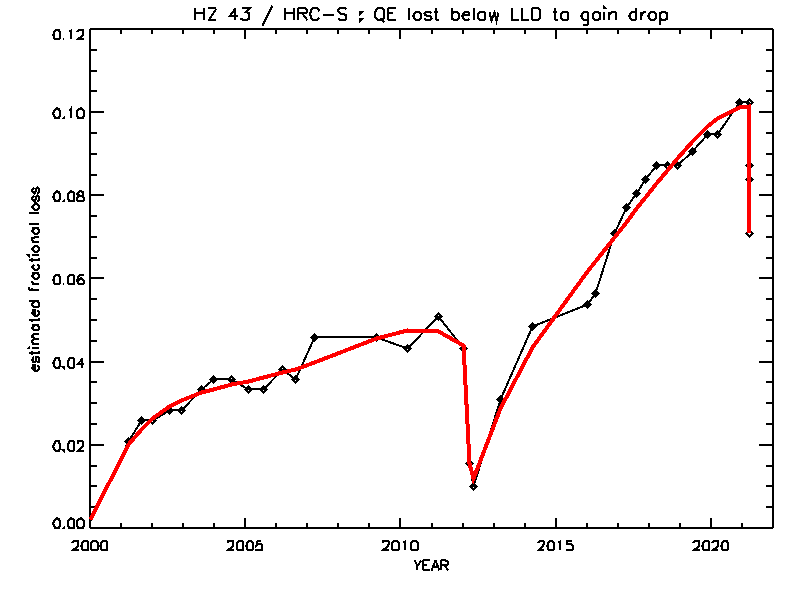
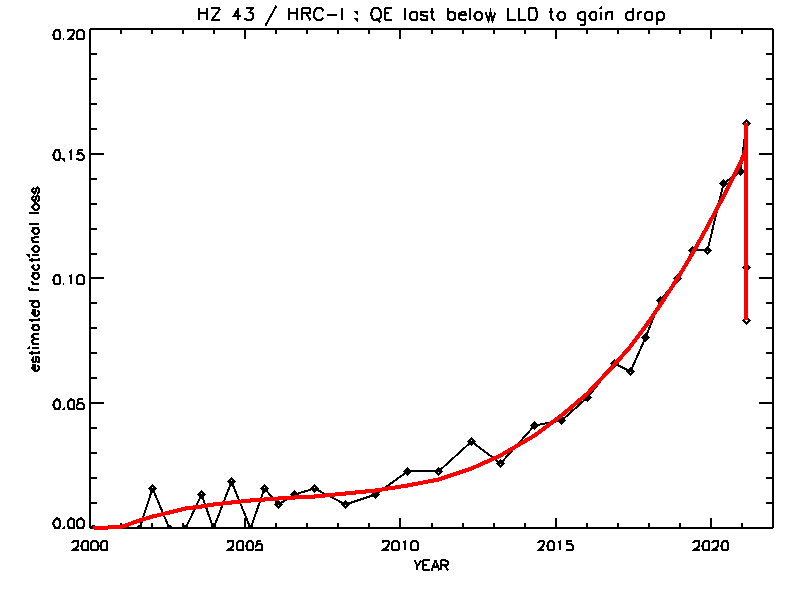
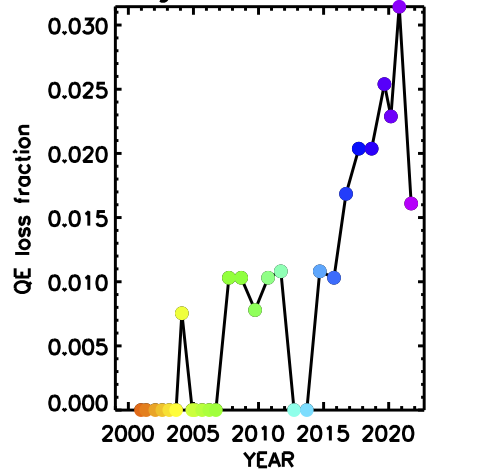
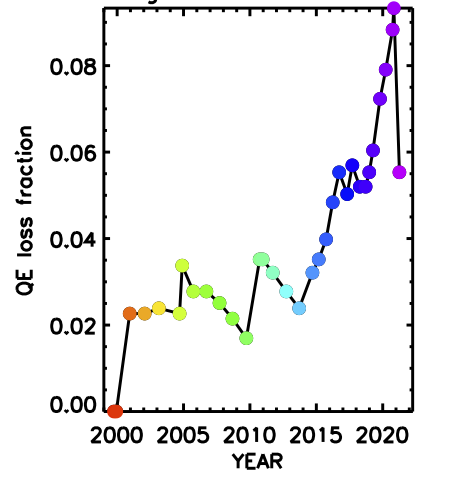
The white dwarf HZ 43 is observed regularly with both HRC-I and HRC-S, and shown below (Fig HZ43) are the trends observed in the event loss over time. Because it is a soft source (with most of the events at >70 Ang), it is highly sensitive to changes in the lower-PHA profile, and thus helps to characterize the trends. Notice that all instances of voltage increases are clearly seen in the data.
| Figure HZ43: Estimated QE loss attributable to gain drop for soft source HZ 43. For zeroth-order events, obtained with LETGS+HRC-S (left) and LETGS+HRC-I (right). The smooth red lines represent piecewise polynomial fits to the measured QE loss. The shapes of these curves generally follow the trend of gain drop. The steep drops (in 2012 and 2021 for HRC-S and 2021 for HRC-I) represent epochs when the voltage was raised to offset gain drop. |
|
The polynomial fits are:
The active binary AR Lac, which is a harder source than HZ 43, also shows this effect (Fig ARLac), but to a much smaller extent, demonstrating that there is a significant photon energy dependence to this efect.
| Figure ARLac: Estimated QE loss attributable to gain drop for coronal source AR Lac. For on-axis events, obtained with HRC-S (left) and HRC-I (right). The steep drops in 2021 occured after the voltage was raised to offset the gain drop. Note that unlike for soft sources (e.g., Fig HZ43 above), the magnitude of the effect and the corrective is almost halved, and the effect of the voltage increase in HRC-S in 2012 is not visible in the data. |
|
Note that the event loss below the LLD does not explain the full magnitude of the QE loss. While the size of this effect has been increasing, it accounts for only approximately 40% of the total QE loss on the HRC-S outer plates.
| Figure Wavelength Dependence: Estimated QE loss attributable to gain drop for dispersed sources as a function of wavelength. The colors represent epoch of observation, with red being early in the mission, and blue/violet being the newest. The estimated fractional loss in the QE attributable to gain drop is shown for several wavelengths, spanning all three MCPs of the HRC-S. Notice that the QE loss is increased on the outer plates, which correspond to longer wavelengths. |
|
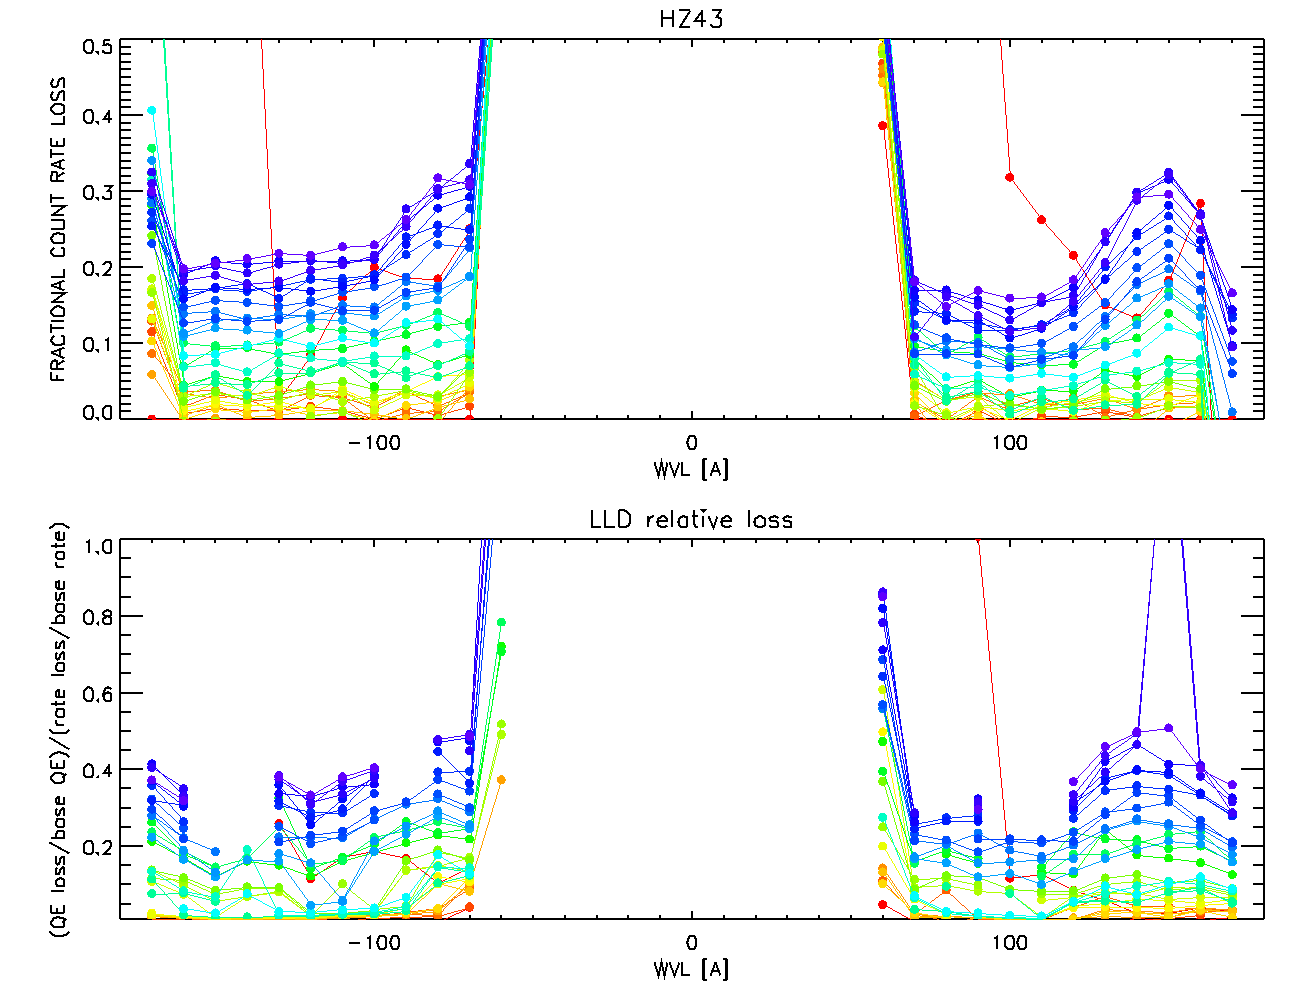
| Figure Unaccounted: Demonstrating that part of the QE loss cannot be attributed to event loss below LLD.
The same data set (and color coding) is used as in Fig. Wavelength Dependence, except that the data on the central plate are ignored as they include source other than HZ 43, and which are not steady. In fact, the upturns at the inner edges of the plates are due to contamination from such sources that occurs due to aspect dither. These plots show the fractional count rate loss (upper panel) and the relative loss in QE compared to the relative loss in count rate (lower panel) for dispersed events from HZ 43. The lower panel is a measure of how much of the count rate loss is directly attributable to the event loss below the LLD: if all of the count rate loss were due to the LLD effect, this would be approximately 1. Instead, it is seen to be negligible at early timees, and increases to ~0.4 at later times, suggesting that not only does the fraction attributable to gain drop increase with time (Fig Wavelength Dependence), but the fraction unexplained also increases. Note that the apparent variations with wavelength seen here are in fact correlated with the spatial variation of gain on the HRC-S. |
|