

|
|
|
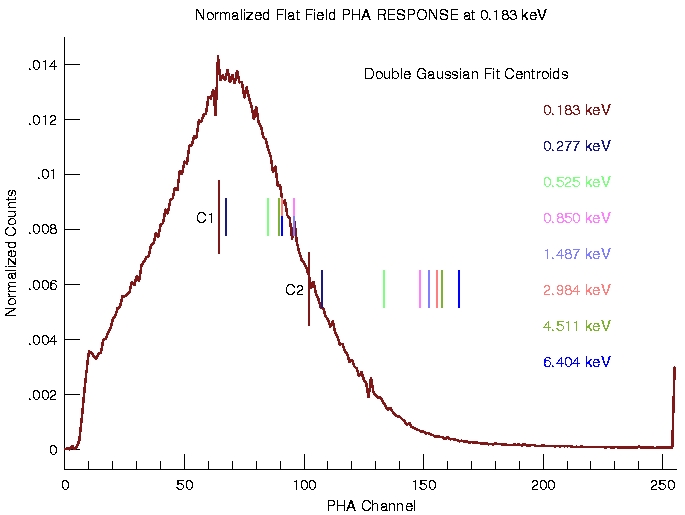
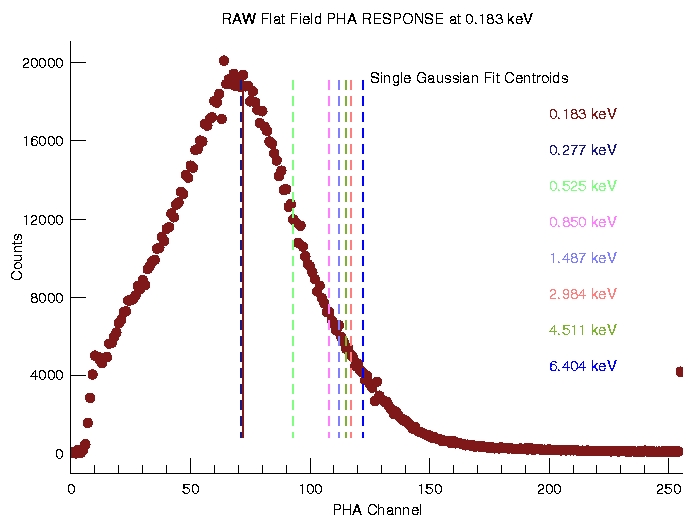
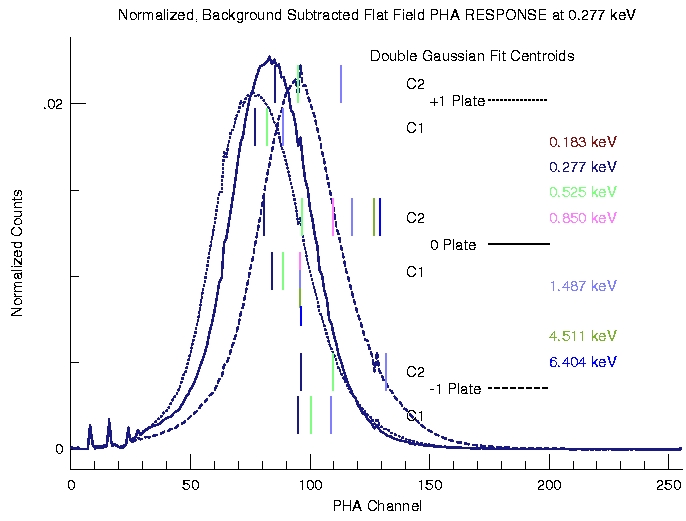
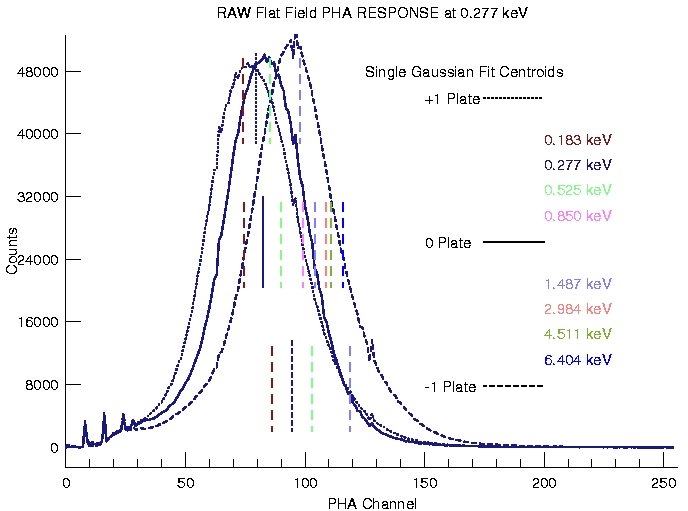
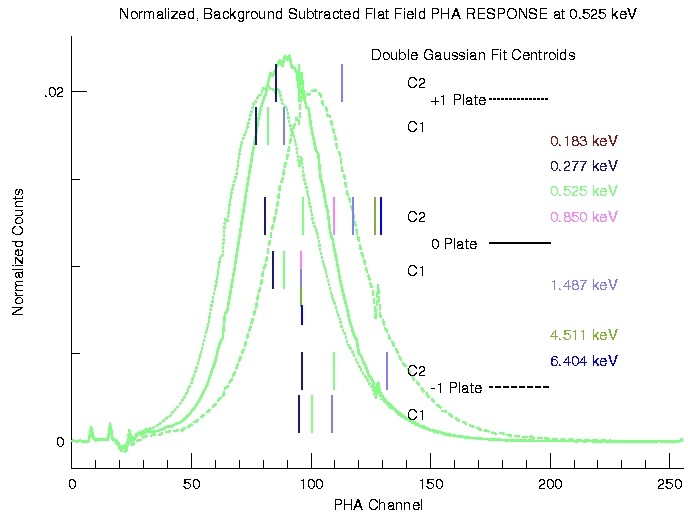
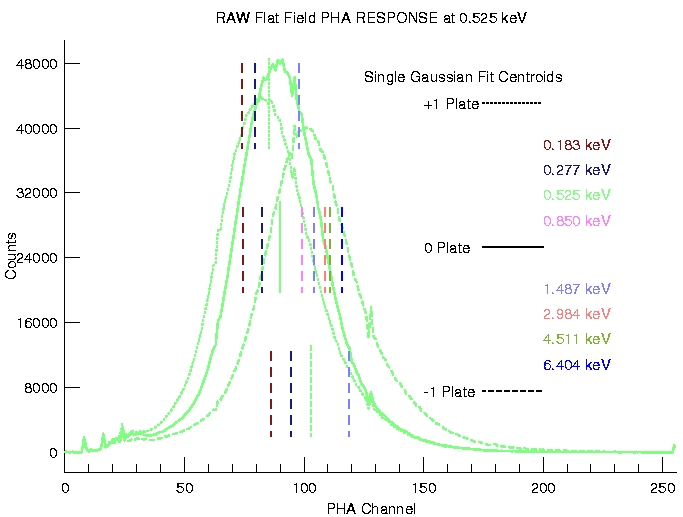
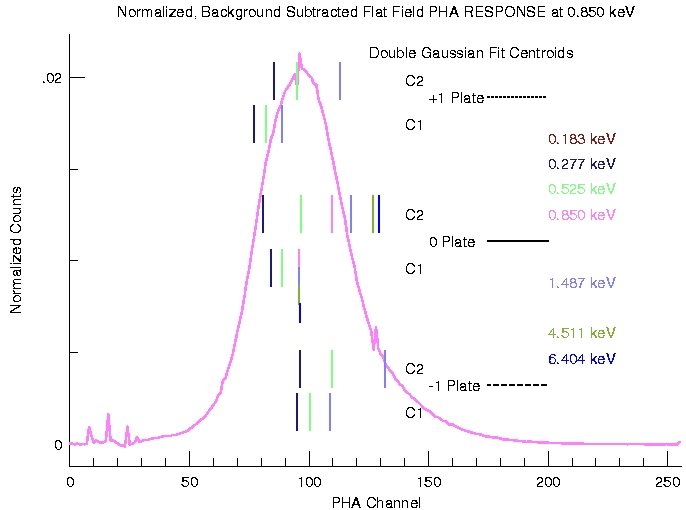
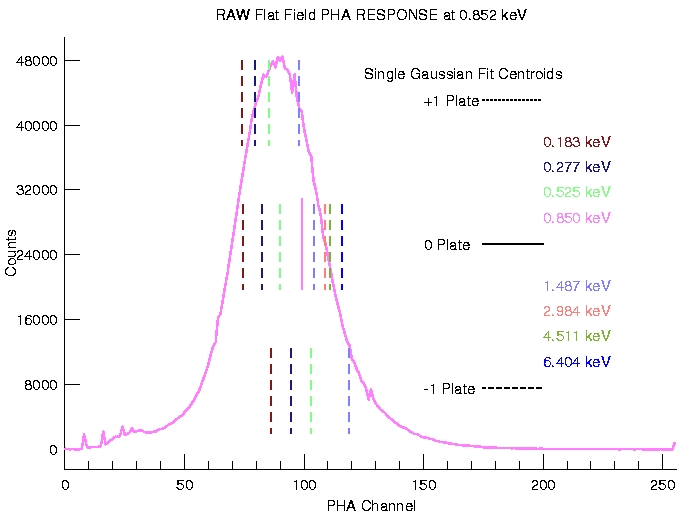
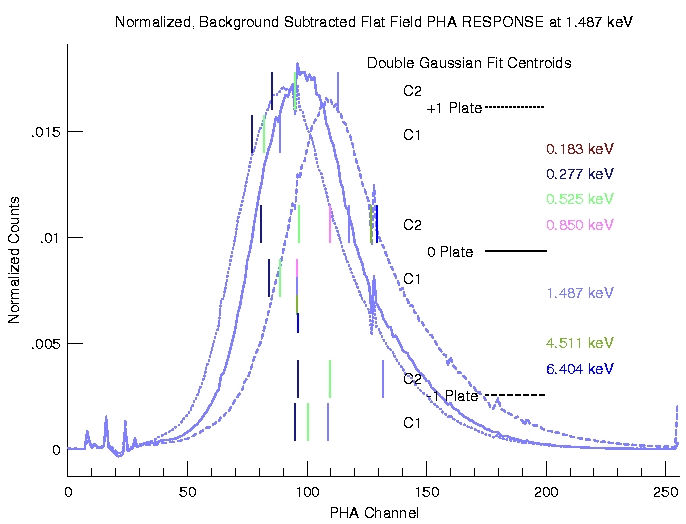
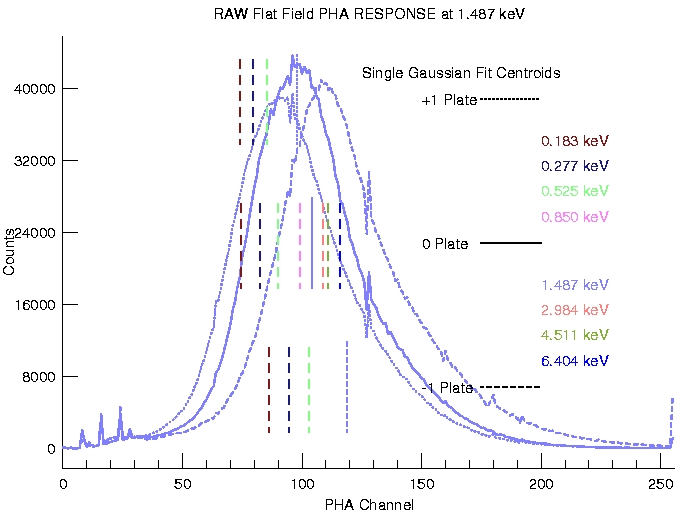
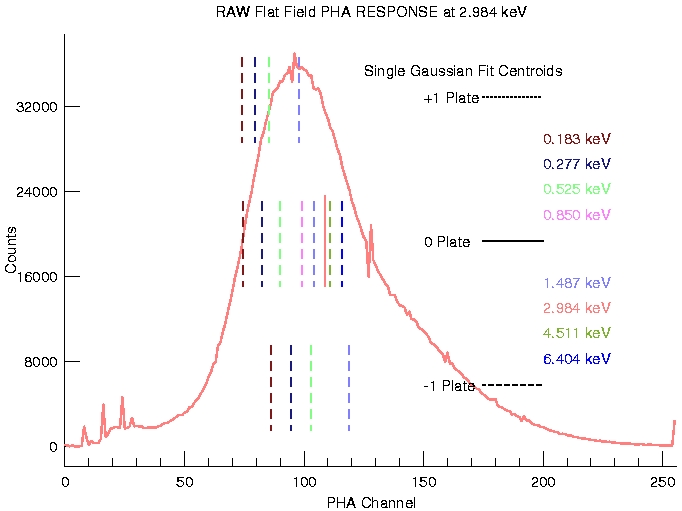
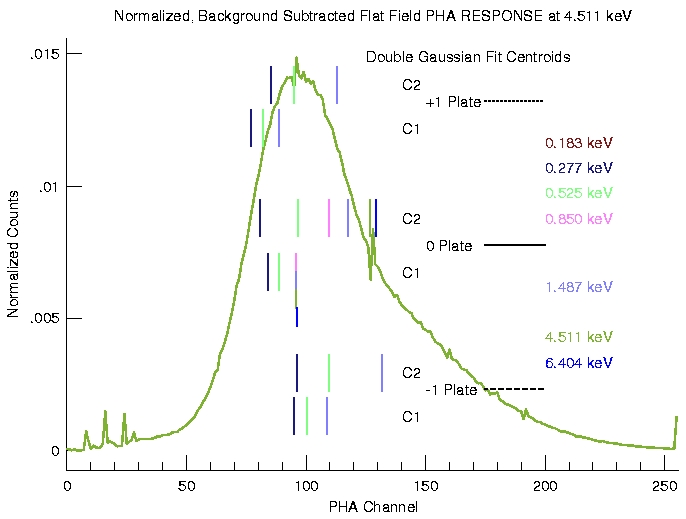
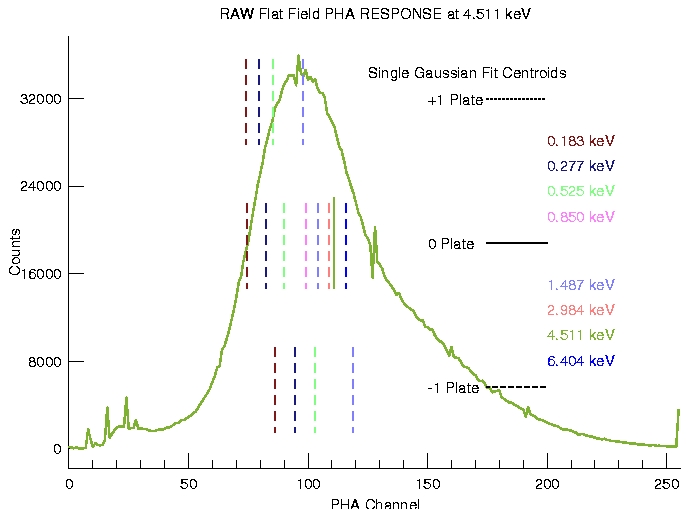
Below are the current calibration products for the HRC PHA.
The most recent products are:
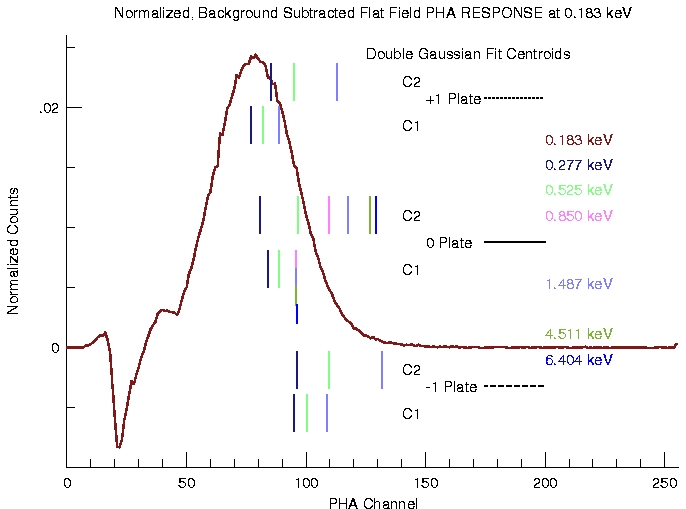
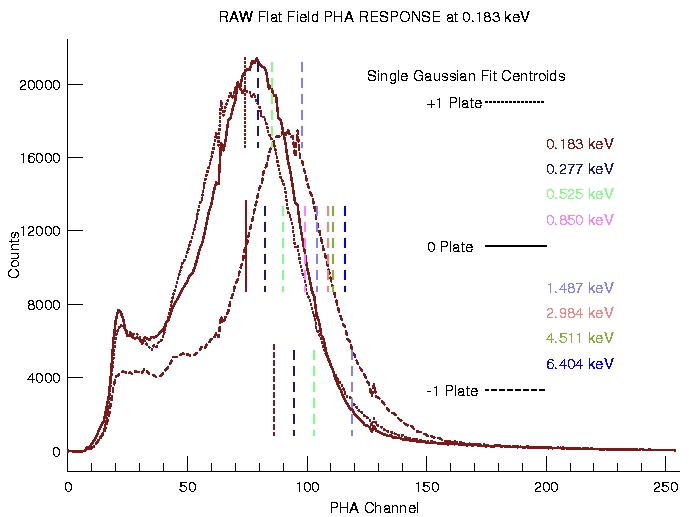
| 0.183 keV v1.1: Plot v1:Plot Data |
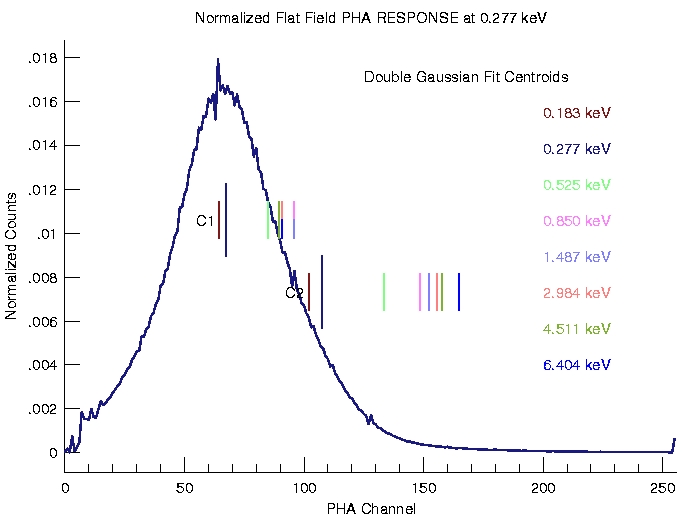
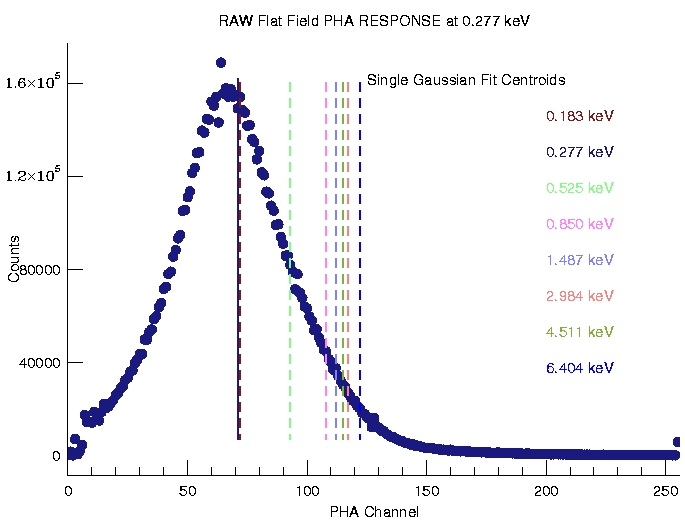
0.277 keV v1.1: Plot v1:Plot Data |
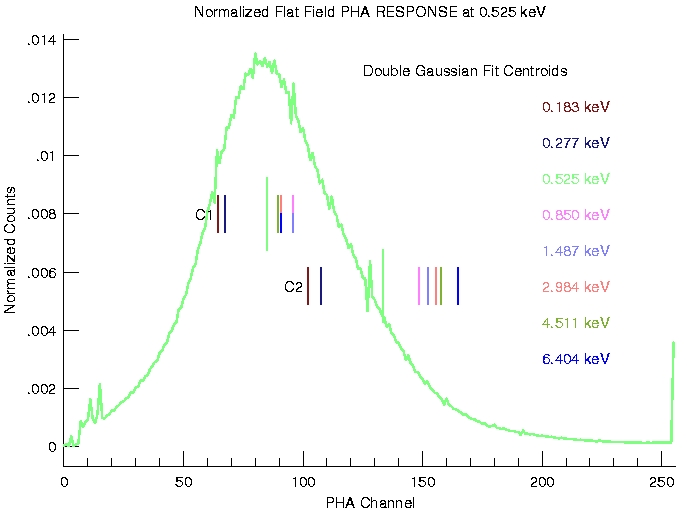
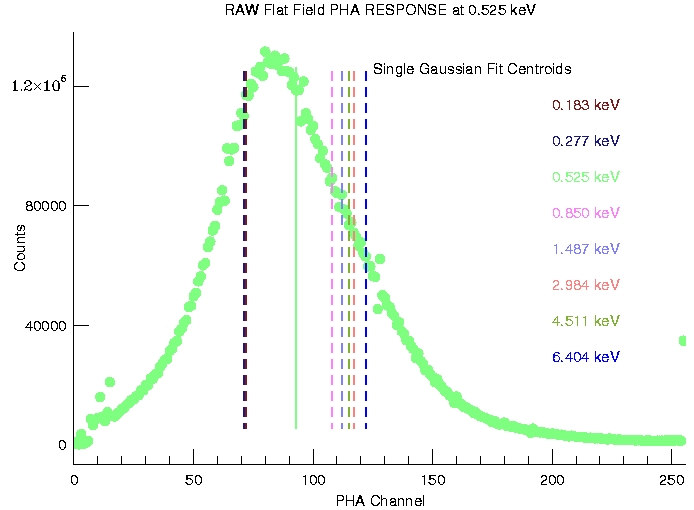
0.525 keV v1.1: Plot v1:Plot Data |
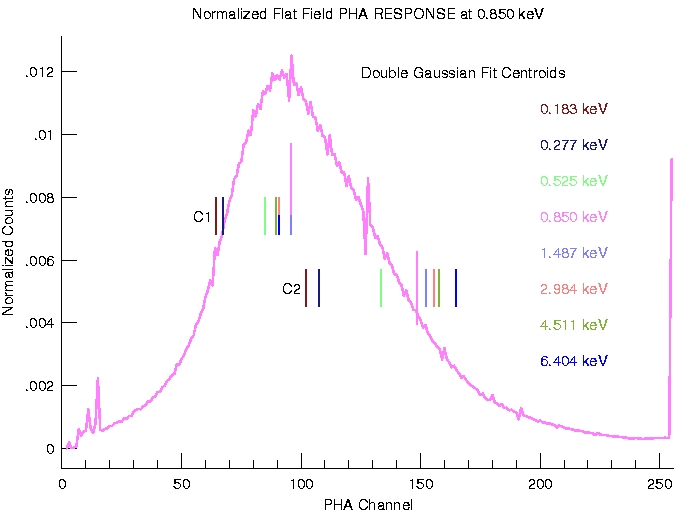
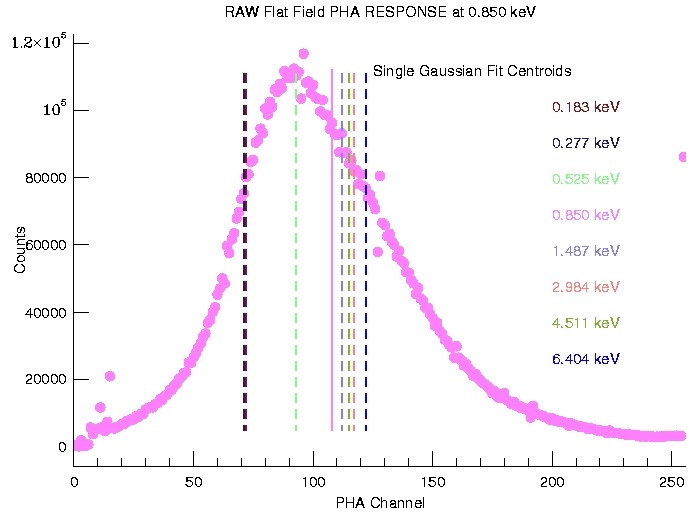
| 0.850 keV v1.1: Plot v1:Plot Data |
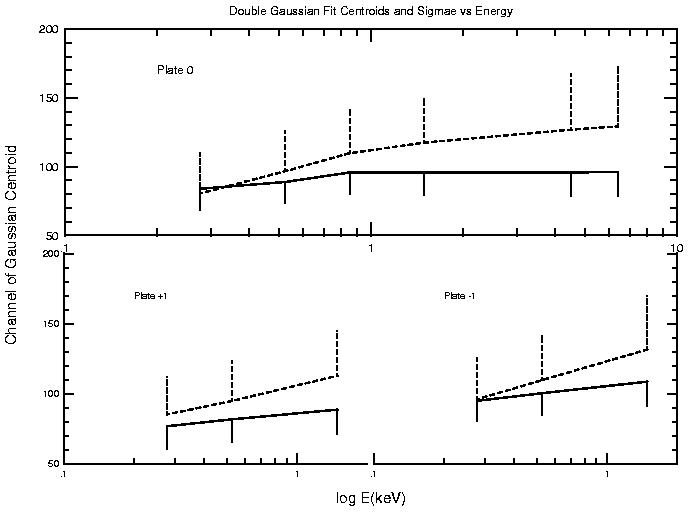
Gaussian Fits v1.1: Plot v1:Plot Data |
1.487 keV v1.1: Plot v1:Plot Data |
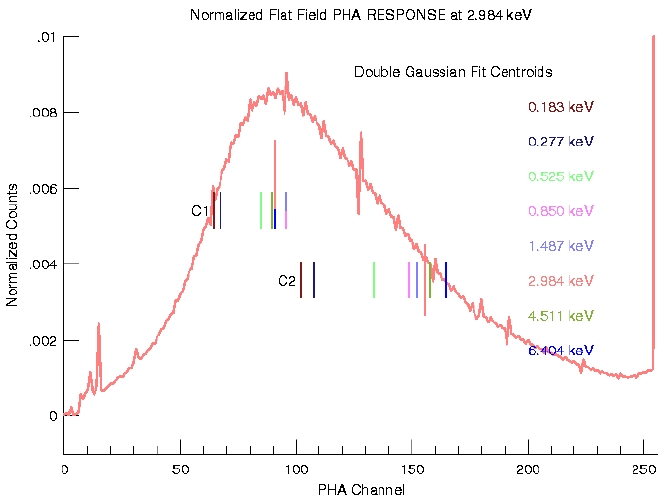
| 2.984 keV v1.1: Plot v1:Plot Data |
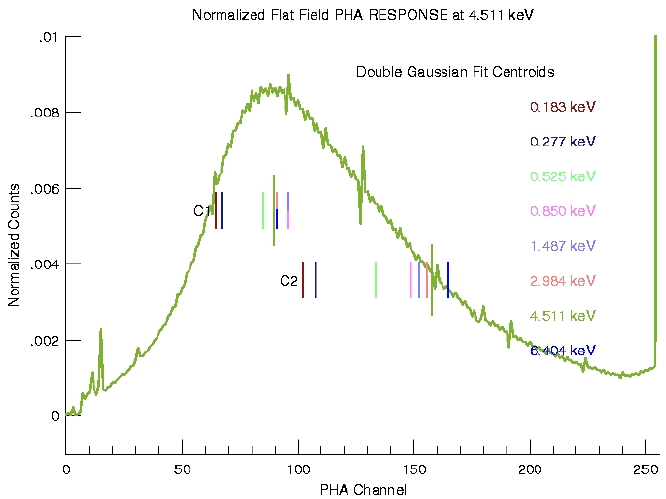
4.511 keV v1.1: Plot v1:Plot Data |
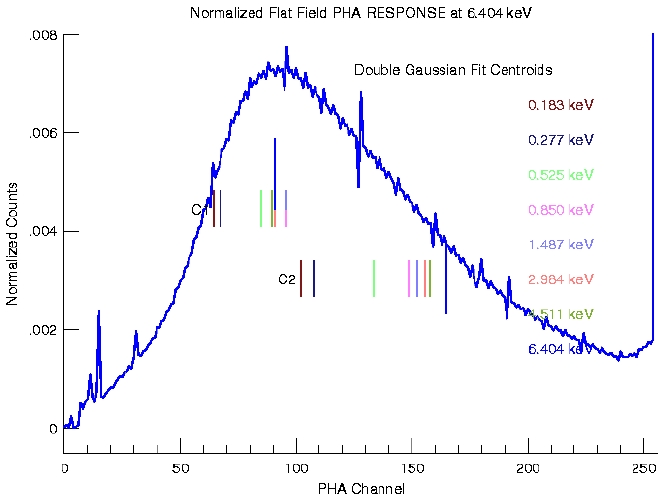
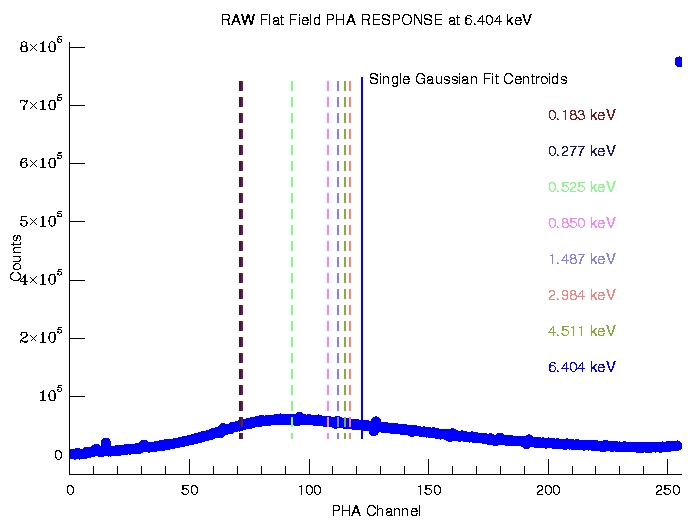
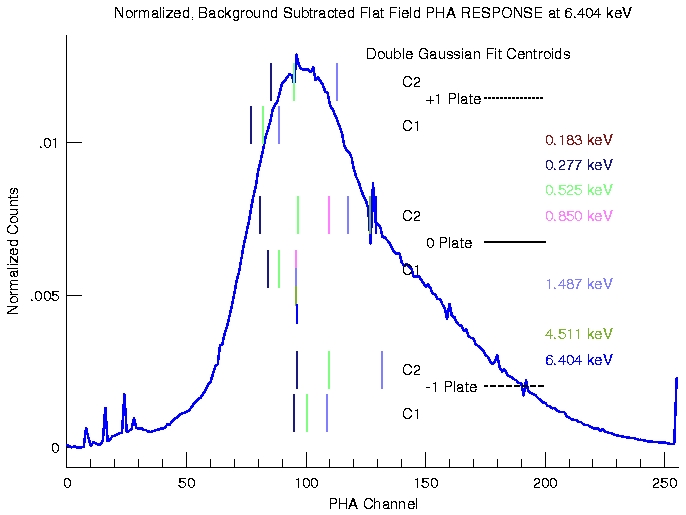
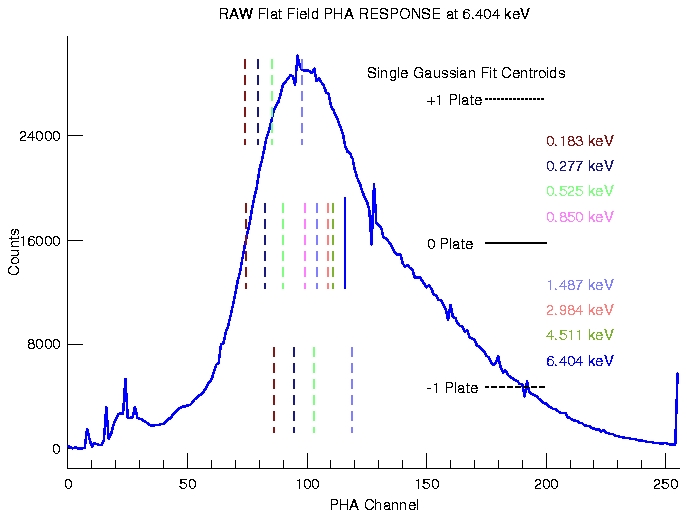
6.404 keV v1.1: Plot v1:Plot Data |
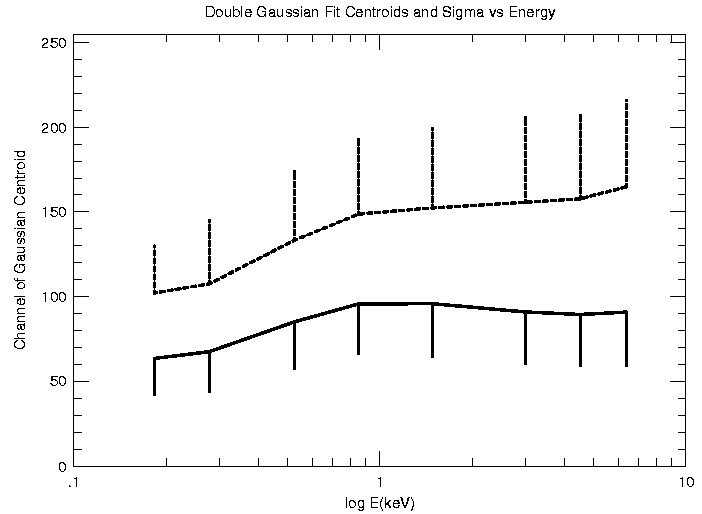
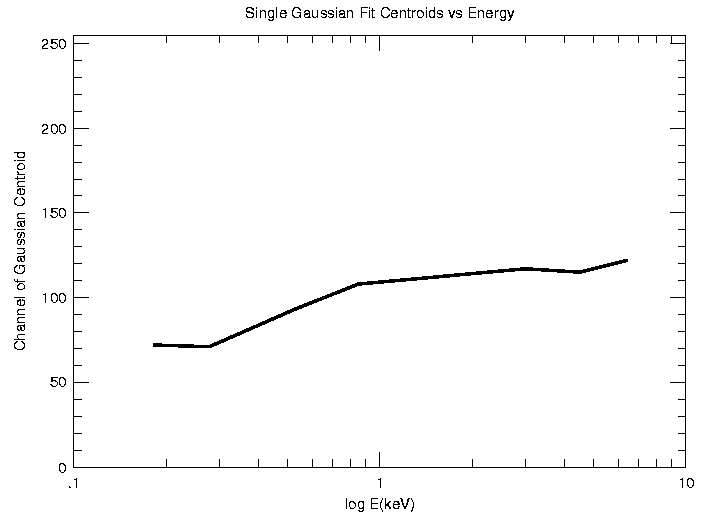
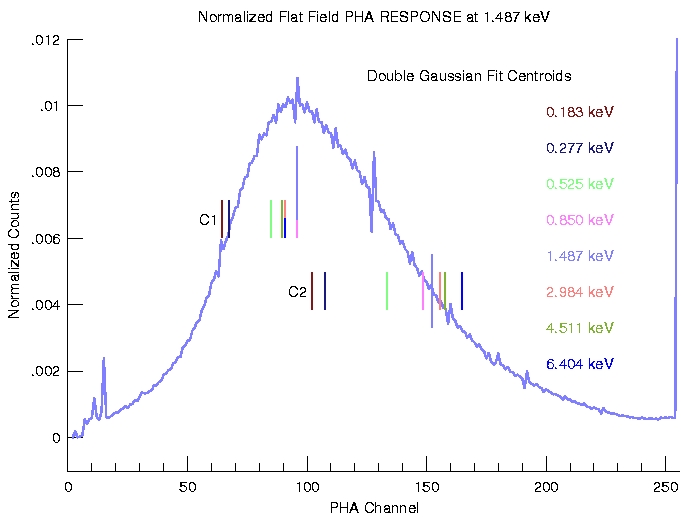
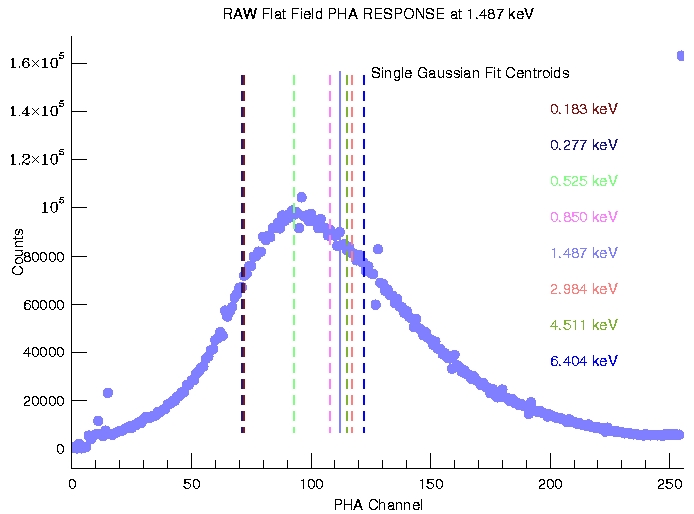
Below 1.485 keV the instruments are the most sensitive to changes in energy, showing steeper declines in all cases. This is further emphasized with the Double Gaussian fits. Not evident from these plots are how the relative normalizations change with energy for the Double Gaussian fits.
Since these observations were made the HRC-I has had its high voltage adjusted downward thus lowering its overall gain such that the center of the plate is at more desirable levels.
| 0.183 keV v1.1: Plot v1:Plot Data |
0.277 keV v1.1: Plot v1:Plot Data |
0.525 keV v1.1: Plot v1:Plot Data |
| 0.850 keV v1.1: Plot v1:Plot Data |
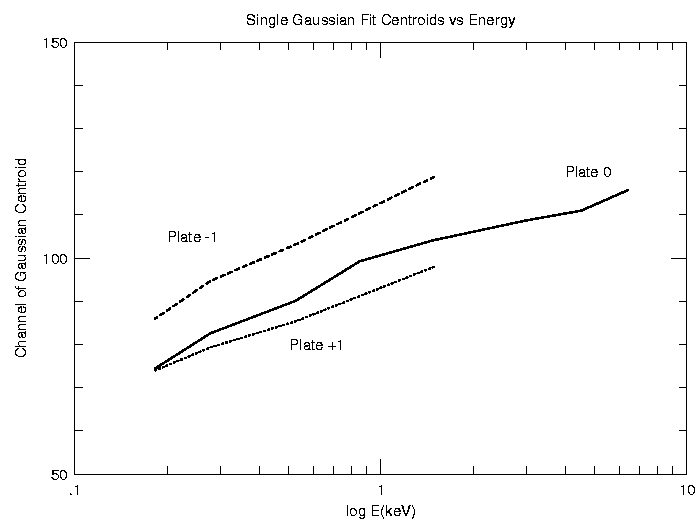
Gaussian Fits v1.1: Plot v1:Plot Data |
1.487 keV v1.1: Plot v1:Plot Data |
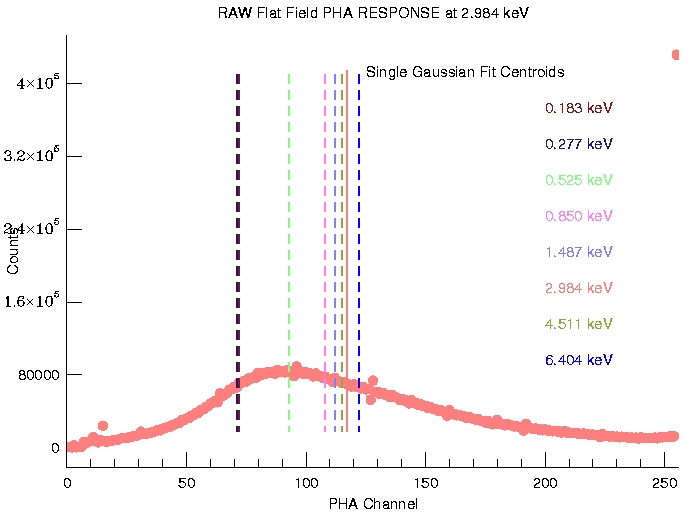
| 2.984 keV v1: Plot |
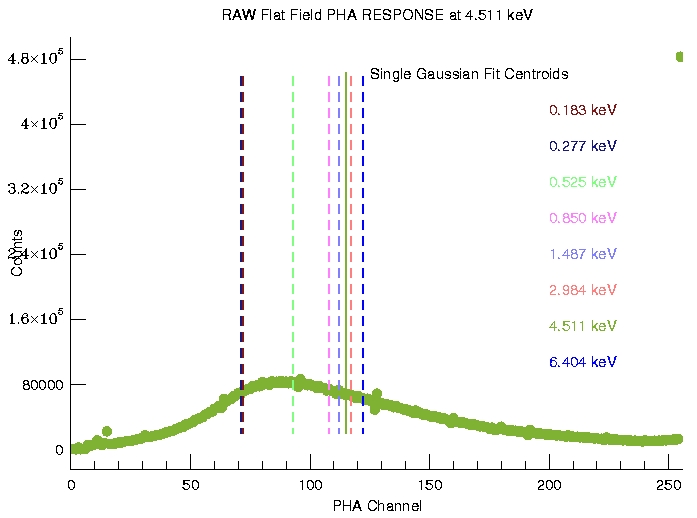
4.511 keV v1.1: Plot v1:Plot Data |
6.404 keV v1.1: Plot v1:Plot Data |
Last modified: 09/27/12
|
The Chandra X-Ray
Center (CXC) is operated for NASA by the Smithsonian Astrophysical Observatory. 60 Garden Street, Cambridge, MA 02138 USA. Email: cxcweb@head.cfa.harvard.edu Smithsonian Institution, Copyright © 1998-2004. All rights reserved. |