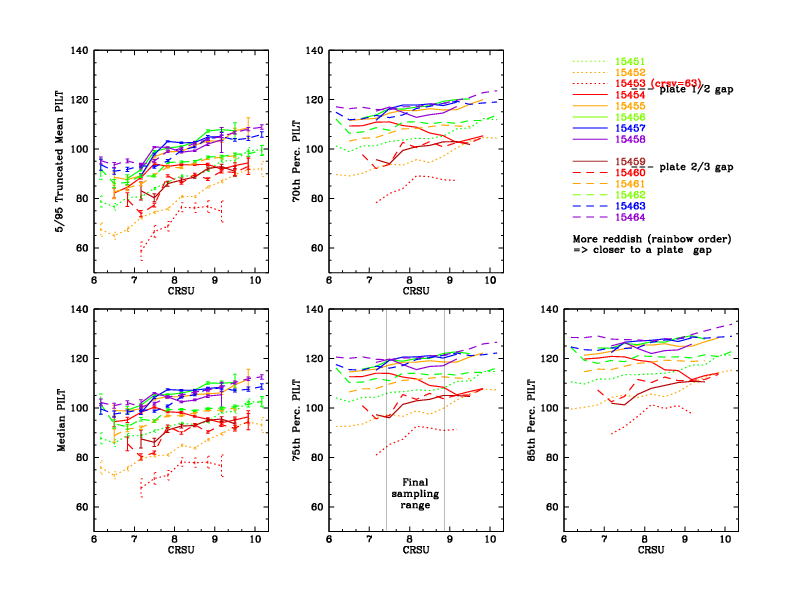


The 2008 calibration used truncated means as the gain metric, excluding events below the 5th and above the 95th percentile in terms of PHD channel, which reduces the mean's sensitivity to outliers and background subtraction. Subsequent work showed that using the median created less statistical scatter in the results, and was also less sensitive to variations in the PHD shape, particularly the low-channel shelf as a function of CRSU (see main page Figure and Figure 1).
The highest statistical precision for percentile metrics such as the median is obtained around the highest channel (mode). As seen in Figure 2, PHD shape changes with wavelength, so that the mode is at a lower percentile than the median at short wavelengths and a little higher at long wavelengths (Figure 3). For calibration of the gain's time dependence, it would therefore be optimal to use the 55th percentile as the metric at long wavelengths and lower percentiles elsewhere, but the statistical advantages are tiny and using the median at all wavelengths is a good compromise that allows direct computation of corrections for higher-order spectral contamination (for which I used the median), and using a single metric at all wavelengths makes it easier to measure and correct spatial gain nonuniformities.
A related consideration is that changes in PHD shape over time, specifically the observed increase in the strength of the low-channel shelf as gain decreases (**add a figure showing this), are primarily at low channels, so metrics such as the median and higher percentiles are relatively unaffected.

|

|

|
| Fig. 1: [pdf] Means vs medians as a function of CRSU subtap. Medians are less sensitive to low-channel variations in PHD shape. | Fig. 2: [pdf] PHDs from lab calibration data illustrating changes in PHD median and shape as a function of photon energy. (I will probably replace these with PHDs from final-product flight-data PI distributions.) | Fig. 3: [pdf] Comparison of mode (highest point in the PHD) with median (50th percentile) and P55 (55th). |