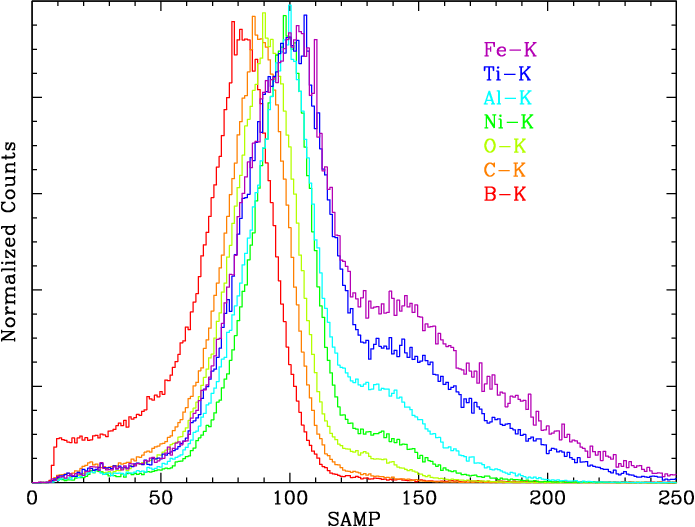


As explained on the main page, HRC-S pulse height distributions (PHDs) have some energy dependence, with higher energy X-rays, on average, producing events with larger pulse heights (see Figures 1 and 2). Some of the observations used in our calibration, particularly those from the power-law sources Mkn 421 and PKS 2155, have significant higher order (HO) spectral contamination in wavelength ranges that we wish to use. In order to correct for the effects of HO contamination on PHD medians we begin by quantifying the contribution of each HO. For the fairly simple spectra of Mkn 421 and PKS 2155, we create gARFs (effective area curves) for plus and minus orders 1-12 of each spectrum, and then fit them with Sherpa using absorbed broken power laws to determine each order's flux as f(λ).
The spectra of the novae (RS Oph, KT Eri, and Nova SMC 2016), however, are
very complicated multi-thermal spectra with both emission and absorption lines,
and impractical to fit with the required degree of accuracy.
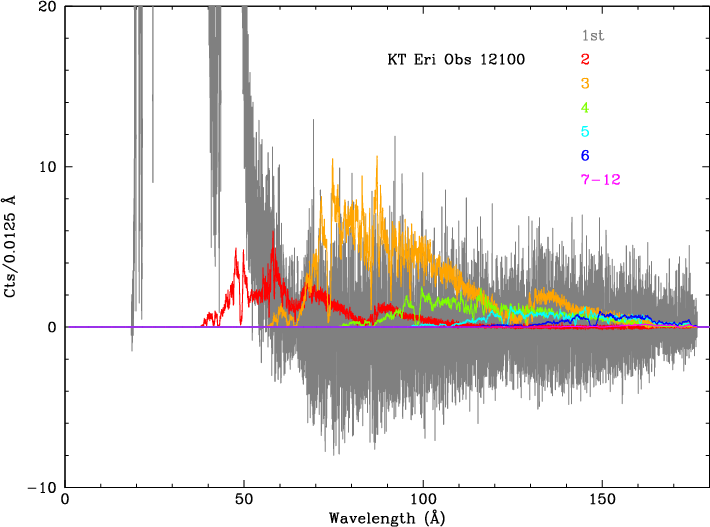
We therefore wrote a program that reads in |m|=1-12 gARFs and
background-subtracted spectra and, using the total spectrum as an initial
estimate for 1st order, computes the HOs by scaling 1st order according to
the gARF ratios, and iteratively subtracts those HOs to yield a pure 1st order
(see example in Figure 3). For each spectrum, to avoid unphysical
negative fluxes and reduce noise resulting mostly from background subtraction,
spectral intensity is set to zero outside a specified avelength range.
For KT Eri ObsID 12100, the 1st order short wavelength limit was set to
18.5 Å
(before beginning the iterative "fitting") and the long limit to
62.5 Å (after iterating and before constructing composite PHDs).
Limits for HOs were set to the corresponding mλ values.
HO analysis results from the novae, which were only observed
on a few occasions, are primarily used to assess the accuracy of our
HO correction method, and in providing HO-free PHDs when
creating the pulse height filter. The calibration of the gain's
time dependence is driven almost entirely by data from
HZ43, Mkn 421, and PKS 2155.

|

|

|
| Fig. 1: [pdf] PHDs from lab calibration data illustrating changes in PHD median and shape as a function of photon energy. | Fig. 2: [pdf] Median pulse height versus λ, from the incomplete 2017 calibration, showing + and - orders and the model curve (black line). Results from the the completed 2020 calibration are very similar. | Fig. 3: [pdf] Example from iterative "fitting" of fluxes in 1st and higher orders. To suppress noise, 1st order flux is set to zero short of a specified wavelength (18.5 Å here). Likewise, after higher orders have been subtracted to reveal the uncontaminated 1st order spectrum at longer wavelengths, fluxes are set to zero beyond some point (m×62.5 Å here). The benefits of cleaned spectra are shown in Fig. 4. |
Once the contribution of each order is known, HO corrections are estimated by using the median vs logλ reference curve in Figure 2 (derived from work in 2017) and computing:
In the above computations we rely on the fact that although the data and curve in Figure 2 are plotted for the case of full spatial and time-dependence corrections, the ratio of different orders' medians will be correct regardless of the local gain because our gain corrections are linear.
The accuracy of HO corrections is assessed by comparing corrected medians with those from pure 1st order spectra which exist for a few times and wavelength ranges. As discussed below and in Figures 5-7, the resulting corrections tend to be about a factor of two too large. We therefore tried a much more complicated but presumably more accurate approach based on actual PHDs rather than their medians.
The alternative approach uses the following steps:
Figure 4 shows that results from the two methods (weighted averages
of medians, and medians from summed PHDs) are nearly the same. Because
the summed PHD method takes much longer to run, we used the
simple average-of-medians method on all HO-contaminated observations.
(The bottom panel of Figure 4 also illustrates the advantage of specifying
the range of real 1st order spectral coverage, for both methods. The
summed PHD method is especially sensitive to PHD channels with negative
counts, which often result after subtracting background from weak
spectra dominated by higher orders.)

| Fig. 4: [pdf] Higher order correction factors using two methods. Bottom panel also compares results from each method with and without specifying a valid data range for 1st order. Results from the two methods are very similar, and as shown in Figures 5-7 tend to be a factor of two too large (e.g., 6% vs 3%). |
The accuracy of HO corrections is assessed by
comparing corrected medians with those from pure 1st order spectra
that overlap in wavelength and are close together in time, e.g.,
HO-corrected Mkn 421 vs pure 1st-order KT Eri,
and HO-corrected KT Eri vs pure 1st order HZ 43 (see Figures 5-7).
The raw corrections tend to be about
twice as big as needed, e.g., the predicted increase in the
net median of of an HO-contamined PHD relative to a pure 1st order PHD
would be 6% but observed increase was only 3%.
I investigated several possibilities
including time dependence (using Mkn 421 data at times of high
and low gain), dependence on the dominant higher order, uncertainties
in HO fluxes, and errors
in the model median vs logλ relationship but found no explanation.
The applied HO corrections are therefore multipled by 0.5.
In practice, medians from data with HO corrections almost always
have larger uncertainties (combined statistical and HO corrections)
than medians from pure 1st order spectra that overlap in wavelength,
so the effects of any systematic errors in the HO corrections on
measured medians once results from all sources are combined is
small and usually negligible.

|

|

| |
| Fig. 5: [pdf] Comparison of medians from Mkn 421 and KT Eri observations close in time, on the inner plate. Top: KT Eri ObsIDs 12101 and 12203 were respectively a few weeks before and after observations of HZ43 and Mkn 421. In the top panel we calibrated their relative gains so that the KT Eri results could be adjusted for comparison with the others. Middle: Medians from combined KT Eri data versus Mkn 421, showing uncorrected medians and those with raw (100%) and adjusted (50%) HO corrections. Middle: Median ratios, (un)corrected Mkn 421 vs KT Eri. 40-44 Å has relatively large HO contamination in Mkn 421 because of the C-K absorption edge. | Fig. 6: [pdf] Medians for observations made ~3/14/10 (or adjusted for comparison): HO-corrected KT Eri vs pure 1st order HZ43 (green), and HO-corrected Mkn 421 vs pure 1st order HZ43 (blue). | Fig. 7: [pdf] Medians for observations made contemporaneously (or adjusted): HO-corrected Nova SMC 2016 vs pure 1st order HZ43 (green), and HO-corrected Mkn 421 vs pure 1st order HZ43 (blue). |
The overall accuracy of the HO corrections is very high,
as shown when
comparing results
from multiple sources after TGAIN corrections are applied.