


|

|
Mike Juda has led the effort to investigate and correct various HRC anomalies such as tap-ringing in the fine-position signals, and to remove "ghosts" and other misplaced events using the "H-test," which is also useful, particularly in the HRC-I, for reducing background. A number of minor problems remain, however, particularly in the HRC-S. These anomalies affect only a couple percent of x-ray events, but they are nonuniformly distributed, and can complicate efforts to filter data, create degap maps, determine the LETG dispersion relation, etc.
We're making progress in indentifying and understanding these anomalies, but it's a slow process. This presentation doesn't present solutions or conclusions, just a description of the issues under study. It should be emphasized that all these problems are pretty minor--we're now at the level where a great deal of effort is required to obtain improved instrument performance.
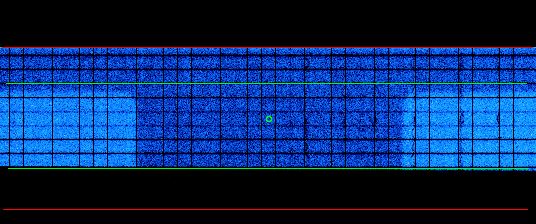
Lab calibration data are available for B-K, C-K, O-K, and Al-K on the outer two plates of the HRC-S, plus another few energies for the central segment. Shown below is most of the central segment, for C-K. The thick-Al portion of the UV/Ion shield is the darker "T", and the nominal aimpoint is marked with a green circle.
The default 6-tap-wide spectroscopy region (taps 5-10) is bounded by the green lines. A wider region, up to 12 taps wide, can be specified for special applications (HRC-S Timing mode, or for extended sources), which contains the 11.4-tap-wide "active" region bounded by red lines. Because of constraints in the HRC calibration facility, the lower 3 taps of the active region are not calibrated (for the gain map, degap coefficients, QE), but this area is almost never used. Degap coefficients have been extrapolated from the lowest calibrated row (5).
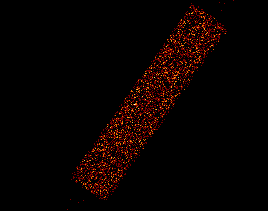
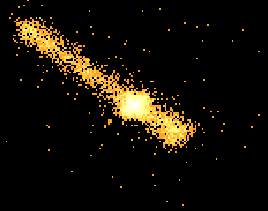
As an illustration of what can happen if the uncalibrated region isn't treated properly, here's a comparison between images using good and bad degap maps. The figure below shows the location of an off-axis calibration source (Ar Lac) lying in the uncalibrated region (left center). Below that are closeups of the source using the uncorrected and new (in the Pipeline) degap maps.
| Old degap | New degap |
|---|---|
 |
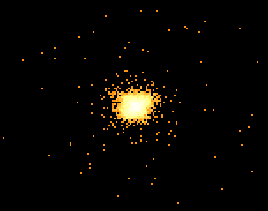 |
The new degap map was derived from lab calibration data, with standard Pipeline filtering PLUS the H-test, which is not used in Pipeline processing of HRC-S data. There is some controversy over whether the H-test should be used to extract data used for the degap map, because of the nonuniform effect it has on the data.
In the figure at the top of the page, one can see dark vertical stripes where filtering has removed x-ray events. The figure below shows all those events which failed one or more status-bit filtering tests. (This is from the same C-K central-segment data set as the figure at the top of the page, but the pattern of "bad" events is pretty much the same on all three segments and at all energies.)

The Pipeline status-bit filtering is relatively uniform, and removes roughly 1% of x-ray events. The H-test removes another 2% of events, of which half are concentrated on the extreme left edge. It should be emphasized that the region shown is within the officially blessed active region. Essentially every event in the roughly 1/2 tap on the left edge fails the H-test. It may be that we need to exclude that region, even though we would increase by gap between segments by another ~1 Angstrom. The remaining bad events tend to make vertical scallop patterns, mostly on the right side of the segment. A blowup is shown below. The scallops are roughly 100 um wide, and at their deepest, well over half of x-ray events are removed.
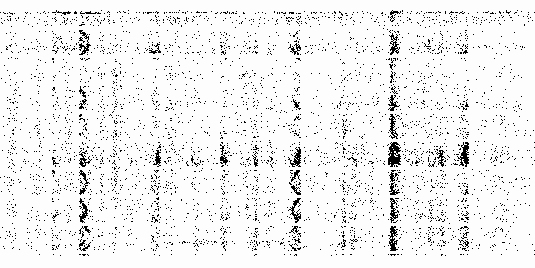
These "bad" events make up only a couple percent of the total, but they all come from x-rays. On the other hand, if they failed any of the tests, there's definitely something wrong with them, and we probably don't want them. Generally it's because their positions aren't reliable, but we don't have a good feel for how bad those positions are. A 5-pixel error is certainly unacceptable, but what about 1 pixel? When using the grating, can we accept larger errors in the cross-dispersion direction? These are issues which are under study, using lab, flight, and XRCF data, but will take quite awhile to really sort out what can and should be done to handle these events.
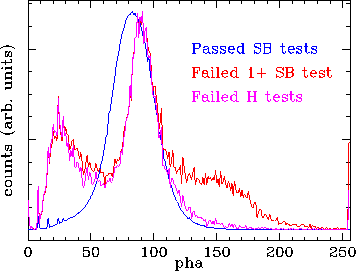
The pulse-height distribution of good and bad events is shown below. The PHA distribution for good events (which passed all status-bit tests including H-test) is broader than the main peak for the bad events because it includes events from a wider range of detector gains. The main point, however, is that the bad-event distribution clearly has two extra bumps. The one on the high side comes from events which fail at least one status-bit test (other than the H-test), while the low-side peak comes from events that fail the H-test.
For now, we don't apply the H-test to HRC-S data because it can
introduce spurious features into spectra. As mentioned, however,
it has been applied to data used to derive the degap map. Most
of the bad events occur on the "high" side of a tap, and so
a "symmetric fitting" method is used to derive the degap coefficients
that essentially disregards data from the high-side halves, but
in some taps the bad events occur on the low side. This can
result in bad degap coefficients --> incorrect event positions -->
incorrect wavelengths and line shapes, etc. Fortunately the
effect seems to be very small since dithering helps to average
things out, but we are working on further improvements.
Last modified: 06/14/02
 |
The Chandra X-Ray
Center (CXC) is operated for NASA by the Smithsonian Astrophysical Observatory. 60 Garden Street, Cambridge, MA 02138 USA. Email: cxcweb@head.cfa.harvard.edu Smithsonian Institution, Copyright © 1998-2004. All rights reserved. |