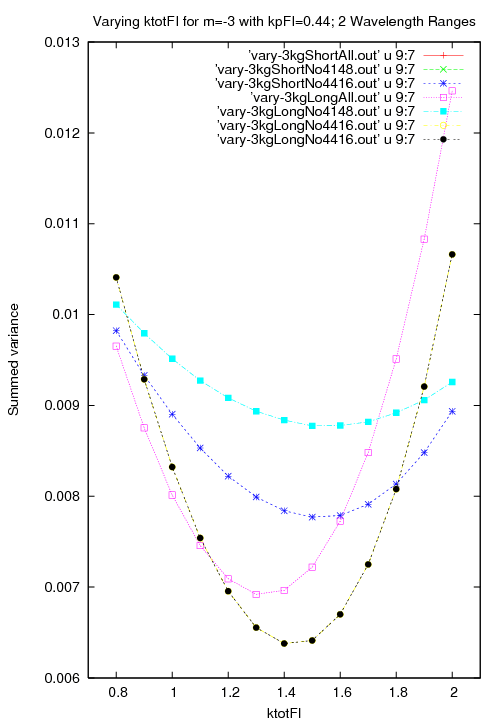
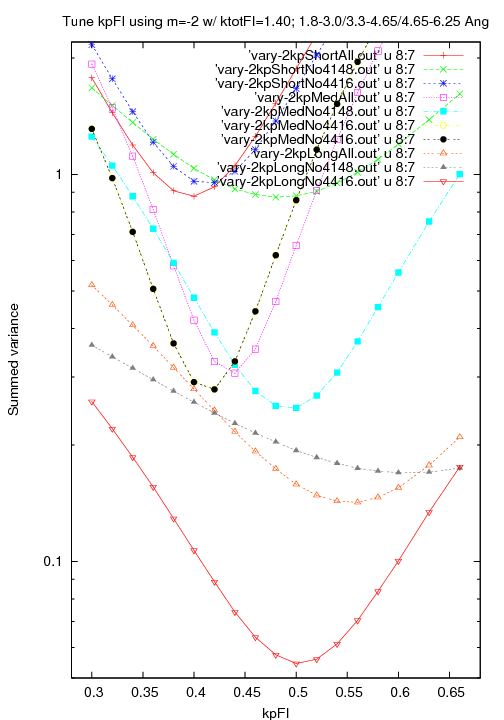
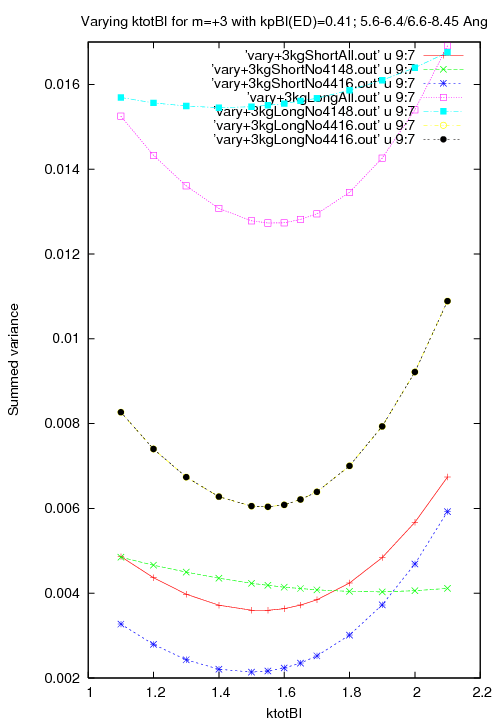
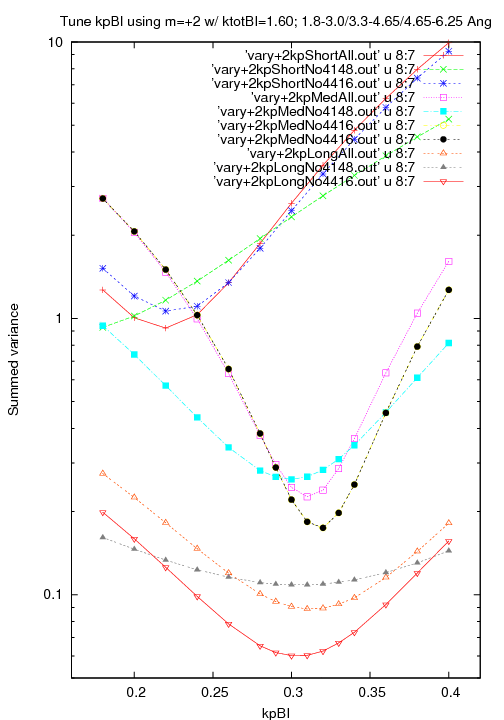
Two wavelength ranges were studied for ktot and three for kp in order to look for energy dependence. Summed variances are plotted in Figs. 1-4, with comments in the captions. Variances were computed using data from all 5 observations, and usually also when excluding ObsID 4416 (to remove the data with the largest statistical uncertainties and therefore most likely to have outliers) or ObsID 4148 (the highest rate observation, with the largest pile-up corrections and therefore most likely to exhibit deficiencies in the correction method). The "No4416" cases often improved constraints on the pile-up parameters, while the "No4148" cases usually just reduced the sensitivity, as one would expect. The choice of best parameter values was somewhat subjective but usually weighted most heavily toward the results using all the data. (In the quick and dirty plots below, yellow and black data points trace the same data.)

|

|

|

|
| Figure 1 (ps, pdf): Best ktotFI=1.40. Short-wavelength results are off-scale but are included in this extended plot: (gif, ps, pdf). | Figure 2 (ps, pdf): Best kpFI=0.41 (Short), 0.42 (Medium), and 0.51 (Long). | Figure 3 (ps, pdf): Best ktotBI=1.53. | Figure 4 (ps, pdf): Best kpBI=0.223 (Short), 0.315 (Medium), and 0.310 (Long). Results when negative pile-up-corrected rates are forced to zero are distorted (gif, ps, pdf). |
|
|
|
Figure 5
(ps,
pdf):
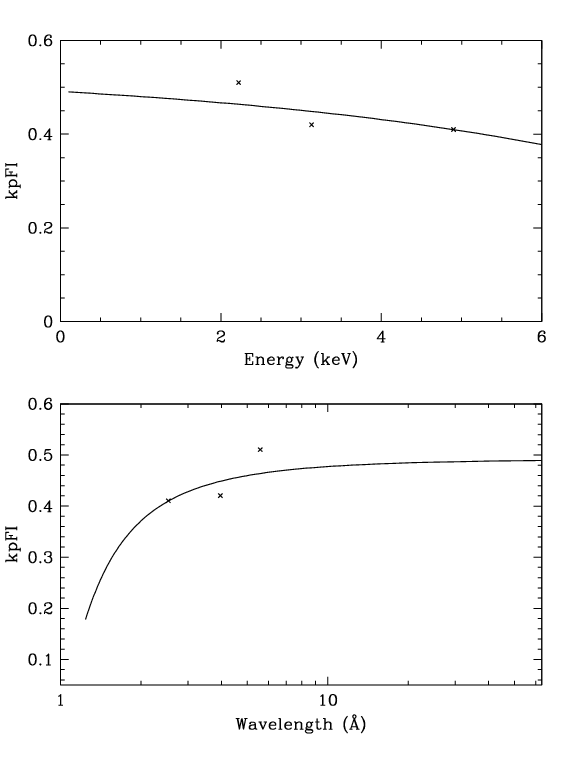
Best kpFI values (from Fig. 2) versus energy,
with an energy-dependent approximation. |
Figure 6
(ps,
pdf):
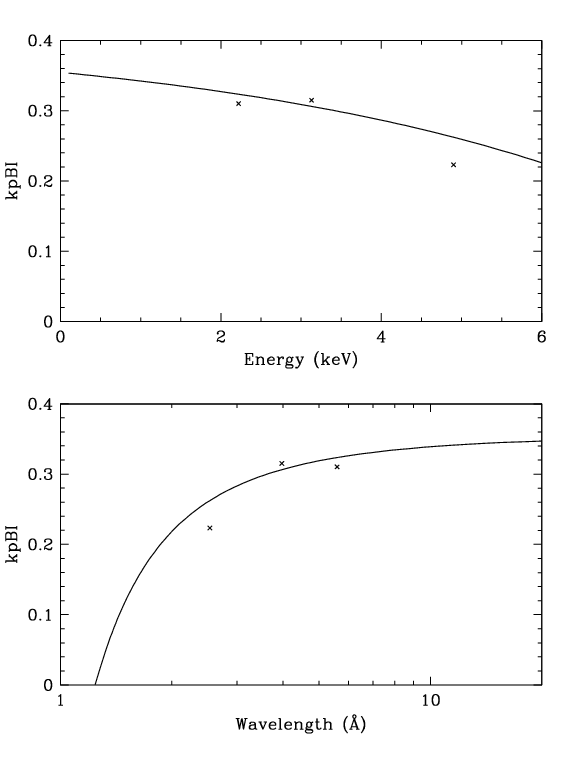
Best kpBI values (from Fig. 4) versus energy,
with an energy-dependent approximation. |
No significant energy dependence was seen in the value of ktot in our wavelength range of interest and the values for the FI and BI chips were set to 1.40 and 1.53, respectively. kp tended to decrease toward shorter wavelengths, which is physically reasonable since the charge clouds deposited by higher-energy photons become larger, activating more pixels in the 3x3 island and therefore causing a higher fraction of grade-migration event losses. (The LSF also broadens toward short wavelengths and a higher fraction of cross-dispersion orders is included within the extraction region, making the collapsed 1-D event rate higher than it "should" be.) Results are shown in Figs. 5 and 6, along with smooth curves that attempt to capture the energy dependence. Uncertainties on the data points are difficult to estimate, and the main consideration in making those curves was to pass near the Long and Medium wavelength results. The true values of kp at the shortest wavelengths are probably smaller than indicated by the curves. Values at longer wavelengths (λ > about 6 Å) are assumed to be close to the "Long" values; any errors there are less important than at λ < 6 Å because 1st-order event rates and therefore pile-up corrections are smaller. The kp values listed below are the long-wavelength asymptotic values used in the energy-dependent version of the pile-up-correction program.
======================================================================
For all obsids other than 1701, using Energy-Dependent kp:
        0.54            FI pileup coeff kp (asymptotic value for ED equation)
        1.40            FI ktot=kp+kg (kg=grade-migration coeff)
        0.41            BI (S1,S3) pileup coeff kp (asymp value)
        1.53            BI (S1,S3) ktot=kp+kg

For 1701:
        0.68            FI pileup coeff kp (asymptotic value for ED equation)
        1.75            FI ktot=kp+kg
        0.46            BI (S1,S3) pileup coeff kp (asymp value)
        1.97            BI (S1,S3) ktot=kp+kg
======================================================================
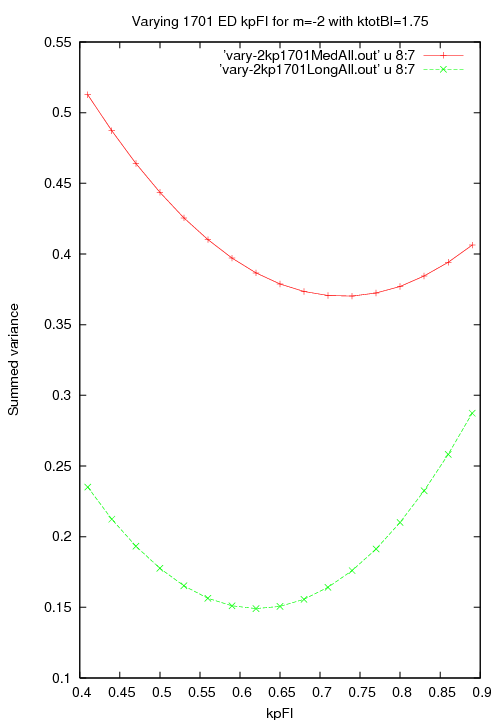
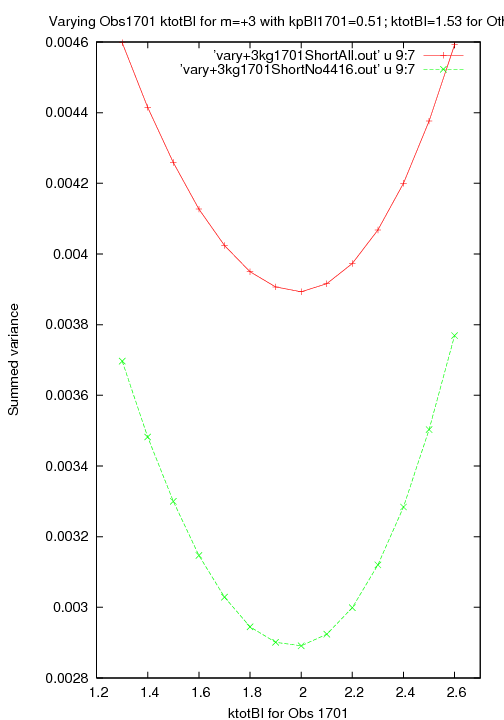
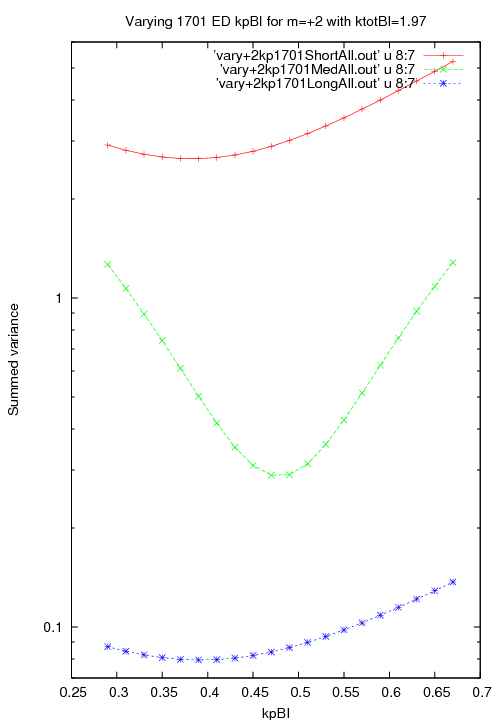
As discussed on the main page and shown in that Fig. 7, the pile-up parameter values for ObsID 1701 are expected to be somewhat larger than those for the 5 other ObsIDs. After fixing the pile-up parameters for the latter, the parameter tuning process was repeated for 1701's ktot and kp, assuming that kp had the same form of energy dependence and differed only by a scaling factor. The ktot value for BI chips was found to be ∼29% larger than for the other ObsIDs, and kp ∼12% larger. The FI kp was ∼26% larger. Because of 1701's different Yoffset, very little of the pile-up-affected negative 1st order spectrum fell on the FI S2 chip and so results results for the -3rd/-1st ratio have almost no sensitivity to the FI ktot value; we therefore simply scaled it up by 25% from the value for the other 5 ObsIDs.
|
|
|
| Figure 7 (ps, pdf): Best kpFI (coefficient for energy-dependent equation) is 0.68. | Figure 8 (ps, pdf): Best ktotFI=1.97. | Figure 9 (ps, pdf): Best kpBI (coefficient for energy-dependent equation) is 0.46. |
Looking at Fig. 9 on the main page it appears that the true-pile-up corrections might be overdone (kp too large) short of ∼4 Å. With this in mind, we noted at the end of the "GREFF Adjustments" section that "At the shortest wavelengths, where statistics are poor and pile-up corrections are often large, we erred on the side of not departing too far from a correction factor of 1." The practical significance of errors at such short wavelengths is, however, probably negligible for any imaginable LETG observation.
Given that a second ACIS event occurring anywhere in the 3x3-pixel island surrounding the first event will produce a pile-up event, why is ktot not equal to 3? First, our method uses event rates obtained from a spectral extraction region that is then condensed in one dimension; the second event has a not-insignificant probability of occurring a few or several pixels away in the cross-dispersion direction, and will therefore not interfere with the first event (see main page Fig. 7). More importantly, some of the outer-8 pixels in the 3x3 island might already have been activated during the 1st event, and the 2nd event might not add to the effective event rate depending on which pixels it activates.
Why do all the order-efficiency ratios have dips near 12 Å? (See GREFF correction factors for even and odd orders.) This is not understood but probably has something to do with ktot being roughly 50% larger than in the 2004 analysis. For the 2004 work, relatively little high-rate long-exposure data were available and the analysis used data from only 3 ObsIDs, each of which was observed at a different Yoffset and therefore had a different cross-dispersion profile, which affects the pile-up parameters. The parameters derived from that work were therefore compromise values that undercorrected the data from ObsIDs 4148 and 1701 and overcorrected for ObsID 3669. One would expect, however, the largest pile-up correction errors to occur at wavelengths with the highest counting rates, around 7-10 Å, rather than around 12 Å. In any case, the present analysis has several advantages over the older work and the results provide significant improvements to the accuracy of higher order GREFFs.