HRC-I XRCF QE/Gain ratio maps
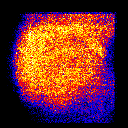
B K 183 eV 183 eV |
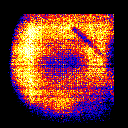
O K 525 eV 525 eV |
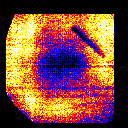
Al K 1487 eV 1487 eV |
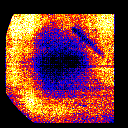
Ti K 4511 eV 4511 eV |
HRC-I Flight QE/Gain ratio maps
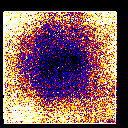
B K 183 eV 183 eV |
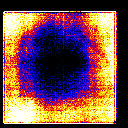
C K 277 eV 277 eV |
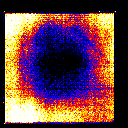
O K 525 eV 525 eV |
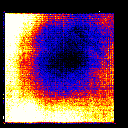
Ni L 852 eV 852 eV |
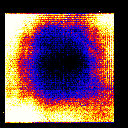
Al K 1487 eV 1487 eV |
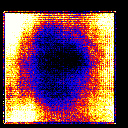
Ag L 2984 eV 2984 eV |
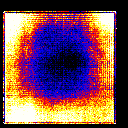
Ti K 4511 eV 4511 eV |
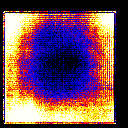
Fe K 6404 eV 6404 eV |
QE-Gain scatter plots
Scatter plots of the QE and Gain of each image/gain cell of SAC flat fields
(blocking factor of 128), from
within the CsI coated region (XRCF images were truncated to exclude the
vignetted area). Due to the large number of data points (11772 for Flight,
8175 for XRCF), only 1/15 of the points are plotted, selected randomly. The
QE values have been normalized, such that the mean of the central 12% of
each flat field image is scaled to unity. Scaling factors were determined
by eye, so that the curves for all energies are continuous.

| |
B |
red |
scale factor = 1
|
|
O |
green |
scale factor = 1.2
|
|
Al |
blue |
scale factor = 1.4
|
|
Ti |
black |
scale factor = 1.5 |

| |
B |
red |
scale factor = 1 |
|
C |
yellow |
scale factor = 1.05 |
|
O |
green |
scale factor = 1.15 |
|
Al |
cyan |
scale factor = 1.2 |
|
Ag |
blue |
scale factor = 1.25 |
|
Fe |
magenta |
scale factor = 1.27 |
|
Ti |
black |
scale factor = 1.3 |


