|
Level 1 event lists for HRC-I observations of selected extended sources were
retrieved from the Chandra archive. Data were filtered though the
"H test" and events from the first few minutes were deleted to
eliminate events during HV ramp up.
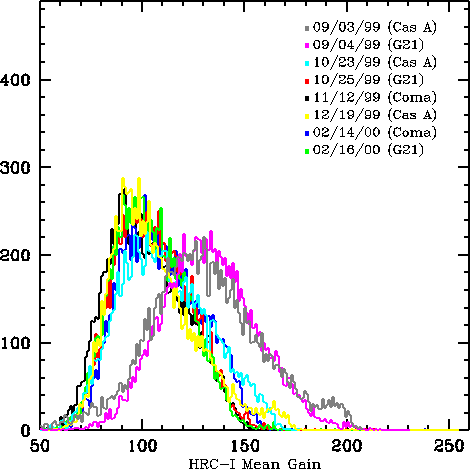
A mean gain (PHA) map for each observation was created
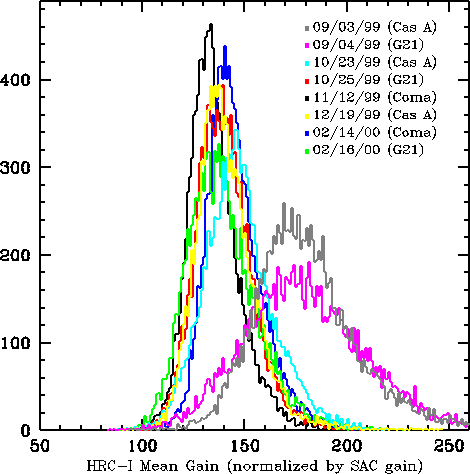
with a blocking factor of 128. These maps were normalized by dividing each map
with a gain map generated by taking the median of gain maps (central
regions were normalized to unity) from SAC
"flight-settings" flat field measurements
["Flight median"].
The histograms and statistics above are for these 128 × 128
gain maps and ratio maps. The
data for the two Coma Cluster observations on each of 12 Nov 1999
and 14 Feb 2000 are combined.
On 4 October 1999, the HRC-I MCP HV final steps were lowered. The top plate was
taken from 79 to 77, and the bottom plate from 91 to 89. This lowered
the overall gain of the detector.
Events from the latter half of the Cas A observation on 10/23/99
were ignored
due to exceptionally high background, likely caused by solar flaring.
| 


