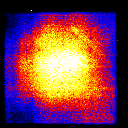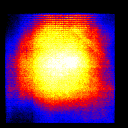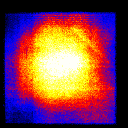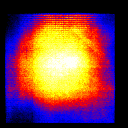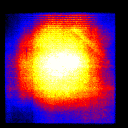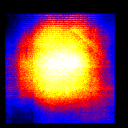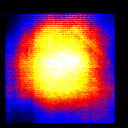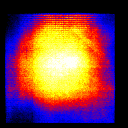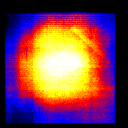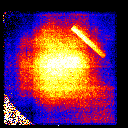
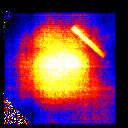
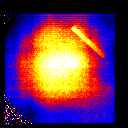
HRC-I XRCF settings gain maps


B K     183 eV

O K     525 eV

Al K     1487 eV

Ti K     4511 eV


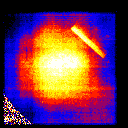
HRC-I Flight settings gain maps


B K     183 eV

C K     277 eV

O K     525 eV

Ni L     852 eV

Al K     1487 eV

Ag L     2984 eV

Ti K     4511 eV

Fe K     6404 eV

click for histogram
Flight median

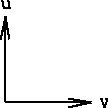
click for focal plane orientation


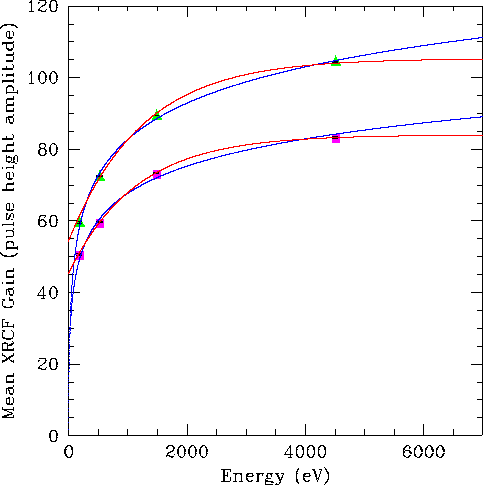
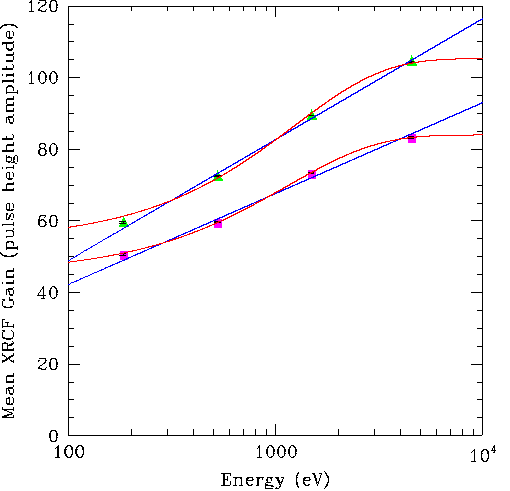
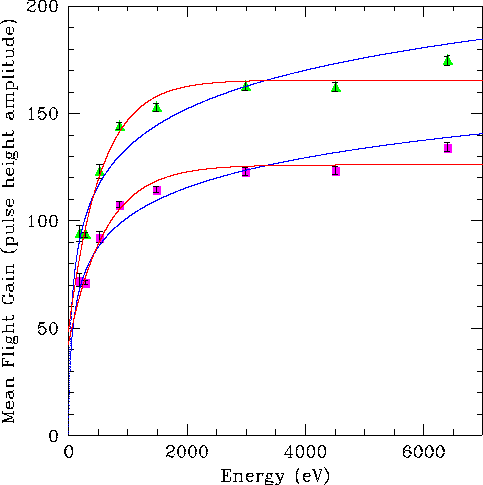
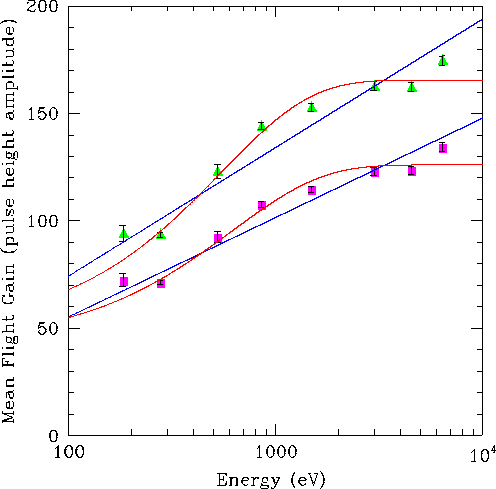
HRC-I Gain(Energy) plots

For all four graphs, triangular data points are the mean gain within the central 12% (square region) of the detector. The square data points represent the mean gain within the CsI coated region (for XRCF data, the entire vignetted area has been excluded). The data have been fit with both exponential (three fit parameters, using IDL CURVEFIT gradient-expansion non-linear least squares algorithm) and logarithmic (two fit parameters, using IDL LINFIT minimum Chi-square algorithm) functions. The two left-hand graphs employ linear axes. The two right-hand graphs are the same data plotted semilog. The error bars were determined by finding the mean of the standard deviation of the pulse heights within each image cell within the region, normalized by the square root of the number of events within the cells.

                central region:
                G = 14.66 × ln(E) - 18.57   [X^2 = 187]
                G = -51.12 × exp(-0.0008102 × E) + 105.4   [X^2 = 123]
                coated region:
                G = 11.02 × ln(E) - 8.490   [X^2 = 240]
                G = -38.77 × exp(-0.0008754 × E) + 84.02   [X^2 = 5.5]


                central region:
                G = 25.98 × ln(E) - 45.38   [X^2 = 198]
                G = -117.1 × exp(-0.001828 × E) + 165.6   [X^2 = 9.4]
                coated region:
                G = 20.09 × ln(E) - 37.24   [X^2 = 126]
                G = -83.58 × exp(-0.001616 × E) + 126.1   [X^2 = 8.9]