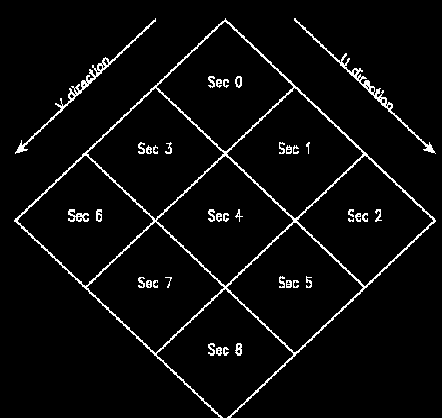
The tables below show the links to HRCI and HRCS exposure history and images. Both instruments are divided into multiple sections to prevent the process overload.
Each section is defined by the following "rawx/rawy" coordinates.
HRC I Sections
Section   0     1      2      3      4      5      6      7      8
------------------------------------------------------------------
X Start   1,    1,     1,  5462,  5462,  5462, 10924, 10924, 10924
X End  5461, 5461 , 5461, 10923, 10923, 10923, 16385, 16385, 16385
Y Start   1, 5462, 10924,     1,  5462, 10924,     1,  5562, 10942
Y End  5461,10923, 16385,  5461, 10923, 16385,  5461, 10923, 16385

HRC S Sections
Section   0     1      2      3      4      5      6      7      8      9
--------------------------------------------------------------------------
X Start   0,    0,     0,     0,     0,     0,     0,     0,     0,     0
X End  4095, 4095,  4095,  4095,  4095,  4095,  4095,  4095,  4095,  4095
Y Start   1, 4916,  9832, 14748, 19664, 24580, 29496, 34412, 39328, 44244
Y End  4915, 9831, 14747, 19663, 24579, 29495, 34411, 39327, 44243, 49159
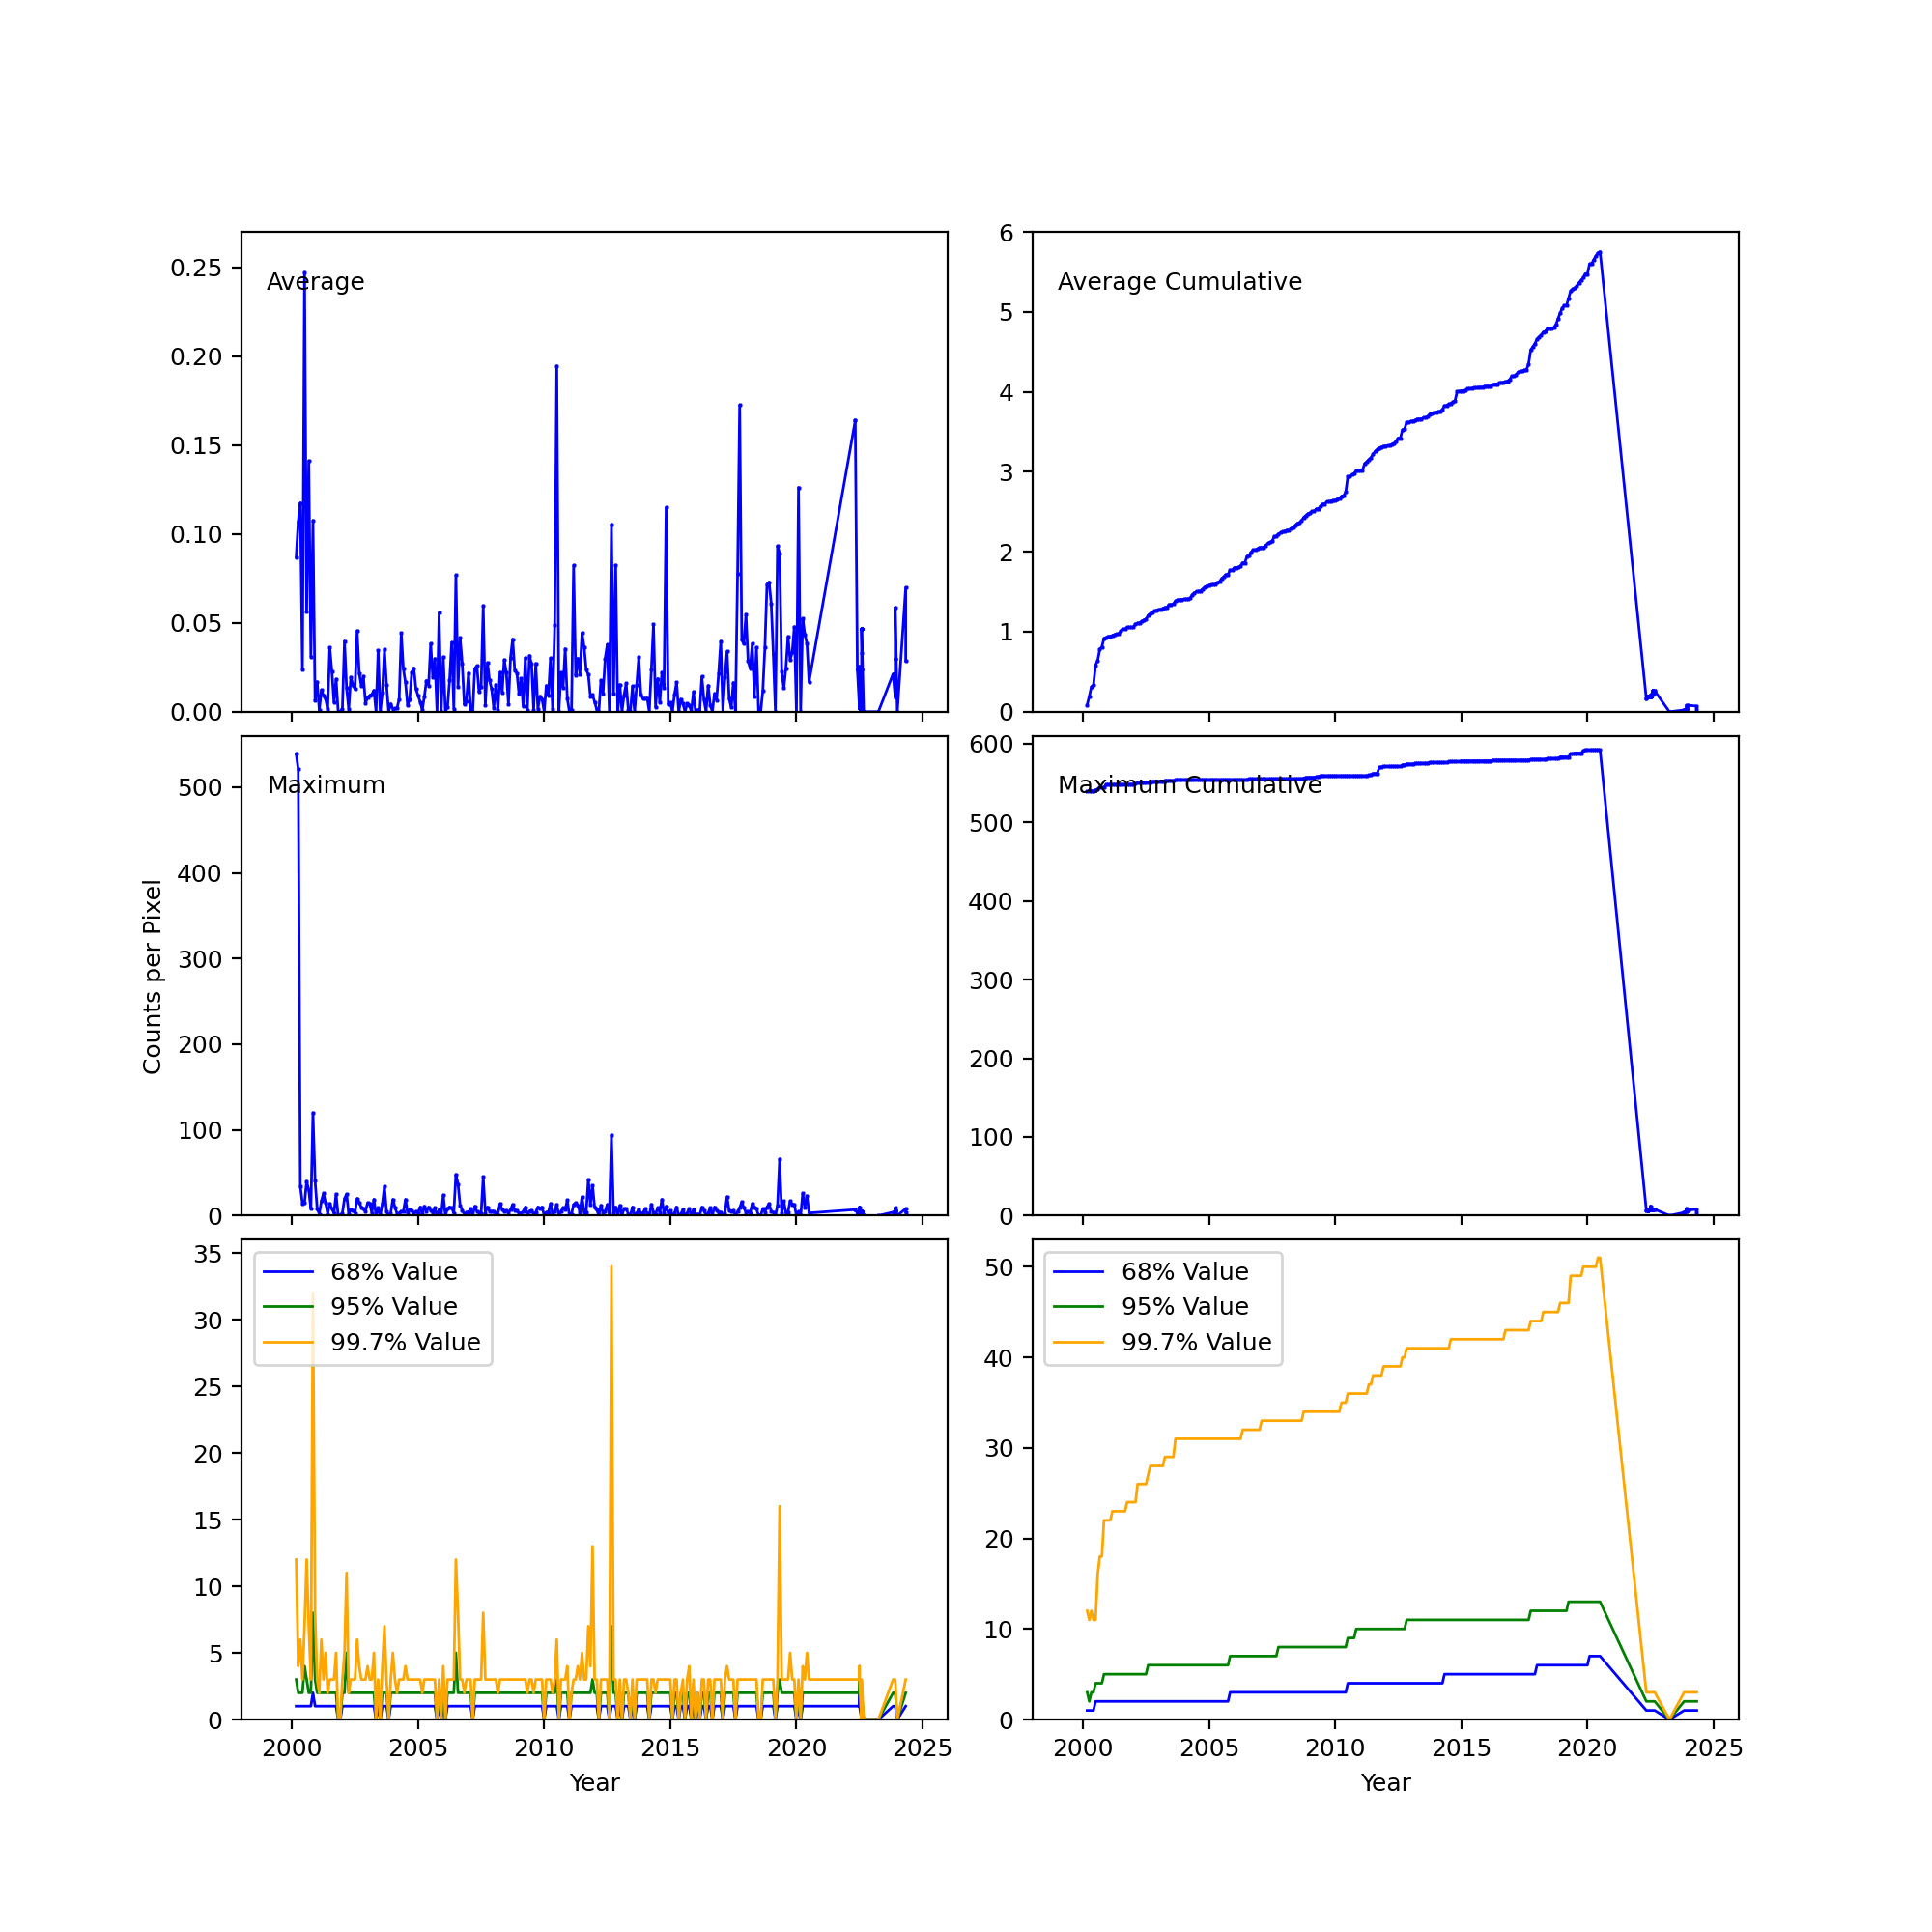
The plot links show plots of history of exposures. The left side shows the monthly exposure, and the right side shows the cumulative exposures. The top panels show the average count rate in cnt/pixel, the middle panels show the maximum count rate and the bottom panels show the count rate of the pixels at 68%, 95%, and 99.7% percentiles. The definitions are the same on both monthly and cumulative data. Since the maximum plot could contain anomalies, a 99.7% plot may represent the maximum trend more accurately.
The data table displays statistics in a table format and also links to the exposure images. By clicking the link "map," you can check the exposure map of that month.


(The plot and the image are those of the latest section 4.)
| Plot | Section 0 | Section 1 | Section 2 | Section 3 | Section 4 | Section 5 | Section 6 | Section 7 | Section 8 |
|---|---|---|---|---|---|---|---|---|---|
| Data | Section 0 | Section 1 | Section 2 | Section 3 | Section 4 | Section 5 | Section 6 | Section 7 | Section 8 |

(The plot and the image are those of the latest section 5.)
Last Data Update: Feb 10, 2022
If you have any question, please contact swolk@cfa.harvard.edu.