HRC-I Degap Update (2012)
The degap look-up calibration
that was developed in 2007 suffers from
a bias to larger than necessary correction near the gap
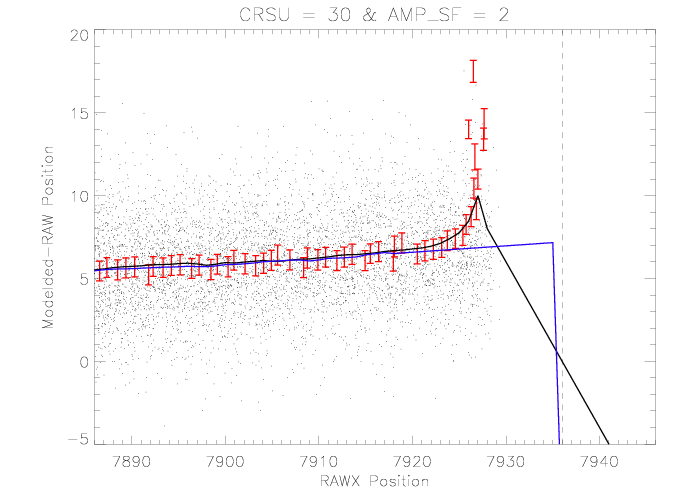
boundaries. This is illustrated in the figure below which shows
the data, information used to derive the degap values and degap
values near one of the edges of CRSU = 30. The degap look-up
values are determined by calculating the source position on the
detector for each event and then determining the mean of the RAW
position for a given modeled position with selected coarse
position (e.g. CRSU) and AMP_SF value. As the modeled position
nears the gap, the deviation is biased to a larger correction as
event begin to appear on the adjacent tap.
|
| Figure 1:Example of the bias in the derived degap
look-up values near a gap boundary (dashed vertical
line). Dots are from the
events from Capella that form the basis of the
determination. The red error-bars show the mean
deviations of events at a given modeled position re-cast
into the RAW space. The solid black curve is the degap
look-up derived from the red-points. The solid blue
curve is the update described here.
|
In the development of the
degap look-up values for near aimpoint region the HRC-S, I
explored improvements to the derivation of
the values in this near-gap region so as to remove or reduce the
bias. First, the normal algorithm is used to determine the
degap look-up values. Then the values within a pad-region
relative to the gap are reset to values determined from a linear
extrapolation from a region of the same width just inside the
pad. The blue curve in figure 1 is the result of applying this
modification.
Most of the degap look-up values are not affected by this change so
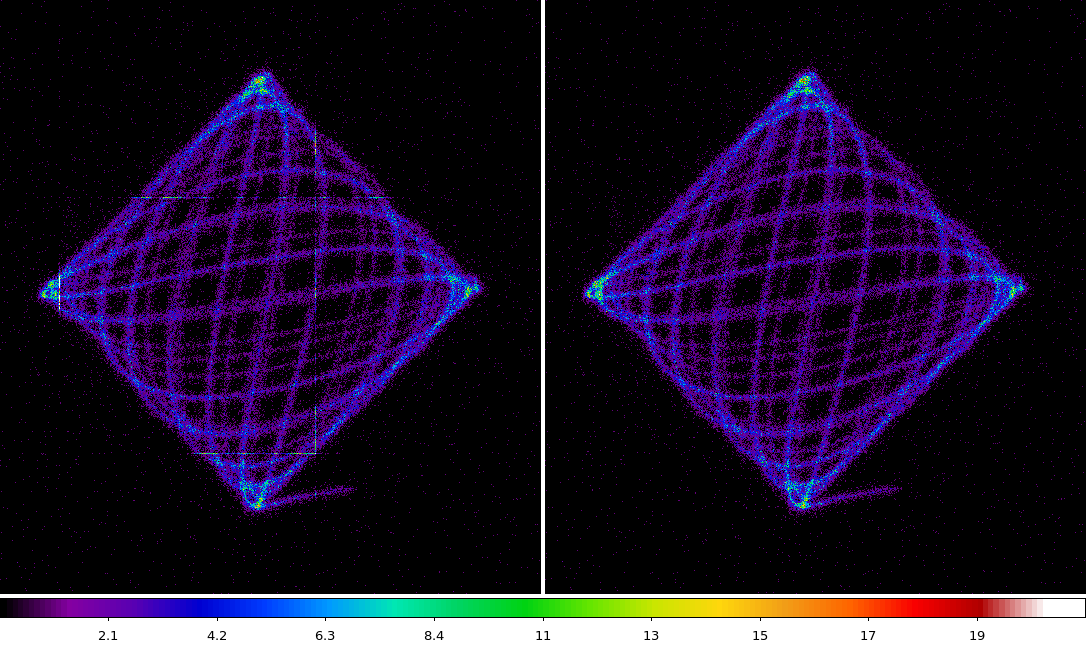
the improvement to image quality is small. The most apparent way
to see the improvement is to plot the source events in CHIP
coordinates. Figure 2 shows such a comparison using data from
ObsID 13182 (AR Lac). The bright straight horizontal and vertical
streaks in the left pane are at the gap locations and are caused
by the biased degap correction. The streaks are strongly
suppressed in the right pane.
|
| Figure 21: CHIP coordinate comparison of AR Lac source
events from ObsID 13182. Left pane uses degap
corrections derived in 2007 and that are biased near the
gap regions. Right pane uses a new degap that has the
near-gap corrections modified.
|
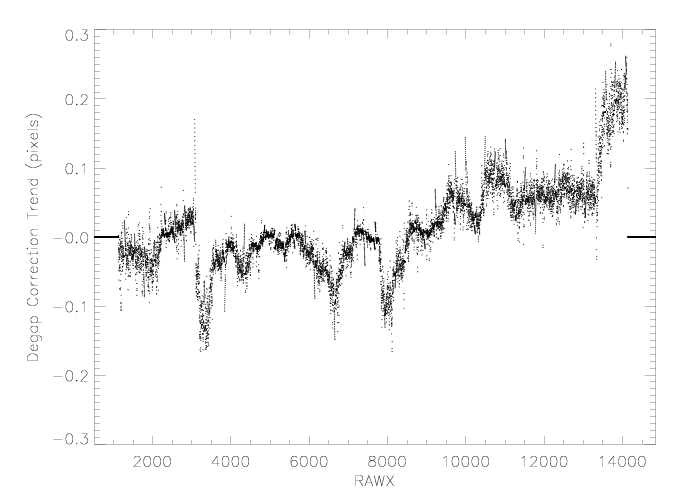
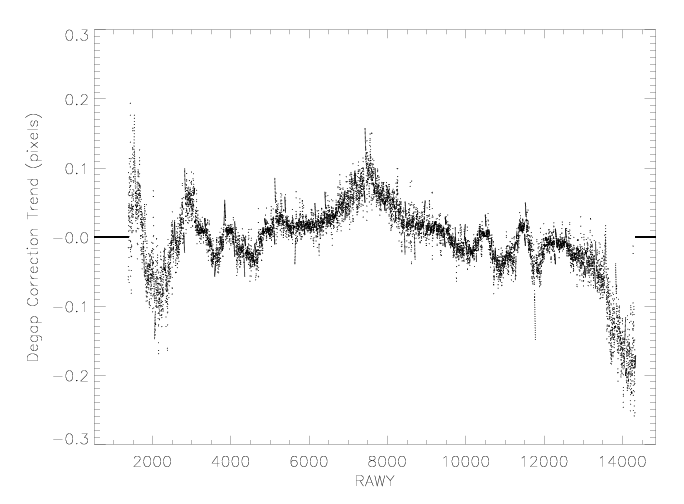
I performed a few iterations of the degap derivation with this
modification with the expectation that there would be minimal
changes other than at the near-gap regions. However, In
comparing the degap look-up values between iterations systematic
trends are apparent. Figure3 shows these trends for the two
axes. The magnitude of the trend is small but the trend is
additive, each iteration grows the correction that will be
applied.
|
|
| Figure 3: Trend in the derived degap correction between
iterations.
|
This systematic trend is a symptom that will occur if the nominal
HRC coordinates of the telescope aimpoint calculated in the
algorithm as the SIM is translated among the observations is
slightly off. The algorithm assumes perfect linear translation
of the SIM and the deviations from this are reflected in the DY,
DZ, and DTHETA columns of the aspect solution. The magnitude of
the trends (≤ ~0.2 pixels or ~1.3 microns) are smaller than
the uncertainties on the aspect solution DY and DZ, The trends may
simply reflect this error in the actual location of the aimpoint on the
HRC for each observation.
The updated degap look-up table is here: hrci_gaplookup_test_d.fits
Last modified: Mon Aug 27 15:18:26 EDT 2012