Copyright 2000 Society of Photo-Optical Instrumentation Engineers.
This paper was published in SPIE Proceedings 4140, 155 and is made
available as an electronic reprint with permission of SPIE. One print
or electronic copy may be made for personal use only. Systematic or
multiple reproduction, distribution to multiple locations via
electronic or other means, duplication of any material in this paper
for a fee or for commercial purposes, or modification of the content
of the paper are prohibited.
Improving Chandra High Resolution Camera event positions via
corrections to crossed-grid charge detector signals
M. Juda, G. K. Austin, J. H. Chappell, J. J. Gomes, A. T. Kenter,
R. P. Kraft,
S. S. Murray, and M. V. Zombeck
Harvard-Smithsonian Center for Astrophysics,
60 Garden St, Cambridge, MA 02138
Abstract
The High Resolution Camera (HRC) on-board the Chandra X-ray
Observatory (CXO) provides the highest resolution X-ray images of
celestial sources ever taken.
Unfortunately, ringing in the electronics compromises the position
readout signals for some of the events.
The compromised signals affect the angular resolution that can be
achieved.
We present an empirically derived algorithm that can be used in
ground processing of the data to minimize the impact of the ringing on
the calculated event positions.
1 INTRODUCTION
The Chandra X-ray Observatory (CXO), the third in NASA's ``Great
Observatories'' series, is designed for high-resolution imaging and
spectroscopy in the energy range 0.07 to 10.0 keV[1].
The CXO optic, the High-Resolution Mirror Assembly (HRMA)[2],
provides the highest-resolution celestial X-ray images ever achieved
with a 50% encircled energy radius of ~ 0.3 arcseconds.
The CXO has two focal plane instruments: the Advanced CCD Imaging
Spectrometer (ACIS)[3,4] and the High Resolution
Camera (HRC)[5].
High resolution spectroscopy is achieved by inserting either the High
Energy Transmission Grating (HETG)[6] or Low Energy
Transmission Grating (LETG)[7] into the optical path.
The HRC contains microchannel plate based X-ray detectors, similar to the
High Resolution Imagers from both the Einstein and ROSAT
missions.
There are two detectors within the HRC: one designed for imaging, the
HRC-I, and one designed to be used as the read-out for the LETG, the
HRC-S.
Details of the calibration and early mission on-orbit performance of
the HRC detectors are given in Kenter et al. (2000) [8] and
Kraft et al. (2000)[9].
Since launch there have been a few surprises in the HRC
performance[10,11].
This paper describes one of those surprises, an instrumental blurring
of the images.
In section 2 we describe how the HRC generates the
data that are used to determine X-ray event positions.
Section 2 also contains a description of a hardware
problem that affects the data from some of the events.
In section 3 we describe the signature of the
corrupted data.
Section 4 contains an empirically derived correction
algorithm that can be used to minimize the amount of instrumental blur
and an example of the results of its application.
Finally in section 5 we have some concluding
remarks.
2 EVENT POSITION DETERMINATION
The HRC uses a crossed grid charge detection scheme to register the
position of the charge cloud produced by an event emerging from the
bottom of the MCP stack[12].
This method was used for the Einstein and ROSAT HRIs.
A detailed explanation of the operating principle of the crossed grid
charge detector (CGCD) can be found in Chappell & Murray
(1989)[13].
Briefly, the HRC CGCD consists of two planes of wires that run
perpendicular to each other.
Adjacent wires along a single axis are connected via resistors.
Every eighth wire is connected to a charge amplifier; this location is
known as a tap.
The charge that is deposited on an individual wire is divided between
the two nearest taps in inverse proportion to the ratio of
resistances from the wire to the taps.
Using the signals from the three amplifiers centered on the charge
cloud (Ai-1, Ai, and Ai+1), the event position relative
to the central amplifier (tap i) can be determined via a ``three tap
position algorithm''[13]:
|
fp = |
Ai+1-Ai-1
Ai-1+Ai+Ai+1
|
. |
| (1) |
This algorithm can be further modified to account for ``gaps'' caused
by incomplete charge collection[13].
This fp is added to the event's coarse position, given by the
number of the tap that is the center of the distribution, and scaled
to produce an event position.
The calculation of the event position is not performed on-board but rather
the coarse position and the size of the three tap signals for each
axis are telemetered to the ground and the calculation is done in the
ground processing.
The event coarse position is determined by the HRC instrument by the
following process.
An event is detected when the signal from the back MCP exceeds a
commandable threshold value.
Once the event is detected, the signals from the taps on the CGCD are
sampled and compared to a threshold.
This tap-signal threshold is dynamically adjusted, based on the size
of the MCP signal, in order to avoid having too many of the tap
signals above threshold.
A set of ``UP'' and ``DOWN'' priority encoders are used to determine
the lowest and highest tap numbers for which the signals exceeded the
threshold.
These two numbers are averaged to return a candidate coarse position;
the half-integer values are truncated.
Given a candidate coarse position on tap number i, a multiplexer
selects four neighboring tap signals, i-1, i, i+1, and i+2,
for the next step in coarse position determination.
The signal on the candidate coarse position tap (i) and that on the next
higher numbered tap (i+1) are compared to determine which tap has
the larger signal; that tap number becomes the selected coarse
position.
The coarse position tap signal and the two adjacent signals are
then selected for digitization and insertion into telemetry.
The three signals are input to amplifiers with selectable gains for
which the gain settings are determined by the amplitude of the pulse
from the bottom MCP.
The selected scale factor appears in the telemetry for each event.
Finally, the three signals are input to ADCs for conversion to serial
digital data and buffering for output into the telemetry stream.
2.1 ``The Problem''
The gains of amplifiers at the input to the ADCs were reduced late in
the program in order to accommodate a larger than expected gain in the
MCP output[14].
Unfortunately, the gain reduction led to a marginal instability in the
amplifiers which was discovered too late to be corrected.
This instability corrupts the data of the telemetered position taps
under a specific set of conditions: the least sensitive amplifier
scale factor is selected and the initial candidate for the coarse
position is incorrect.
When an even number of taps have signals that are above threshold we
expect that half the time the initial candidate for the coarse
position will not have the largest signal (i.e when the event position
is more than half-way to the next-higher-numbered tap).
In the case where the next-higher-numbered tap is the coarse position
that is selected, the event will have Ai-1 > Ai+1 in
equation 1 so the event will be on the negative side of
the tap.
Changing the coarse position from the initial candidate to the
next-higher-numbered tap causes changes in the size of the signals
going into the amplifiers with selectable gains.
Because of the marginal instability on the least sensitive scale,
there is a ringing, generated when the signals are switched, that is
still present at the time that the signals are sampled.
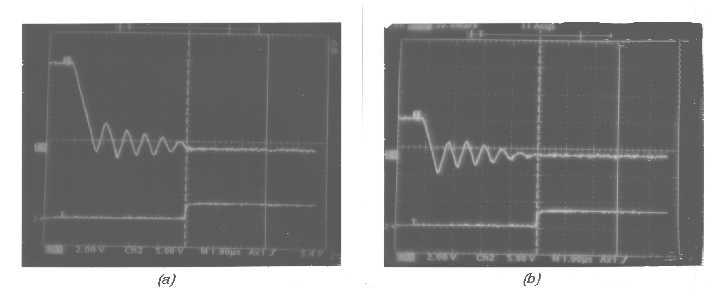
Examples of this behavior, taken in the laboratory using flight-like
electronics, are shown in figure 1.
Figure 1:
Examples of ringing on a tap signal, as observed in a laboratory
version of the HRC flight electronics. The amplitude of the change
in the signal is higher in (a) than in (b). The vertical line at
the center of each photograph is the point at which the signal is
sampled. The signal in (a) is sampled at an earlier phase in the
oscillation than the signal in (b).
The ringing results in offsets on the telemetered tap values from
their true values, with the smallest signal of the triplet for an axis
being the most affected.
When the event position is calculated from the corrupted data, the
positions are incorrectly determined and can be off by a few pixels.
It is possible to at least partially correct the data for the effects
of the ringing during ground processing.
3 CHARACTERISTICS OF SIGNAL CORRUPTION
Ideally we would develop an algorithm for correcting the tap data
through a detailed analysis of the voltage signals; we do not have
this capability with the flight instrument.
We can use the laboratory electronics to understand the general
characteristics required to develop the correction algorithm but the
detailed corrections will not be the same.
However, we can examine the telemetered tap values in the context of
the knowledge gained from the laboratory and use them to derive the
detailed corrections.
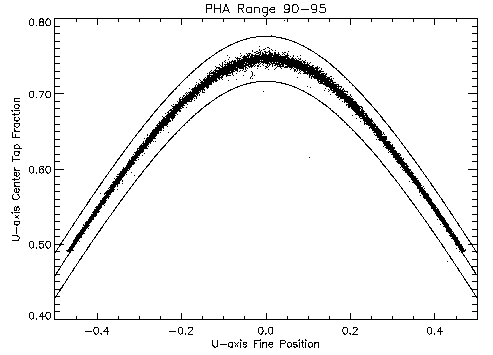
Figure 2 is a scatter plot of fraction of the signal
that is on the center tap versus the fine position (fp) for a
subset of the events that are not affected by the ringing from an
HRC-I observation of supernova remnant Cas-A.
The events lie in a well-defined band in this parameter space that has
a hyperbolic shape[10].
Figure 2:
Plot of the fraction of the charge on the center tap versus fine
position for events showing the ``hyperbolic'' shape of the locus of
well defined positions. The solid lines are hyperbolas that define the
mean locus of good event positions and limits that are used for
screening test used to preferentially select X-ray events relative to
background events or events that otherwise have poorly determined
positions.
The well-defined hyperbolic shape implies that there is a well-defined
relation between the relative sizes of the tap signals as a function
of position across the tap.
We can use these relationships to study the deviations in the tap
signals produced by the ringing in the signals.
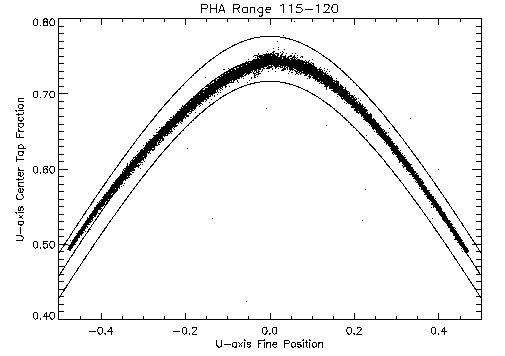
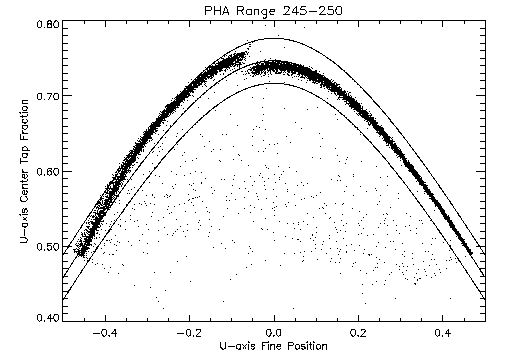
Figure 3 shows two other subsets of data from the same
observation as figure 2; the key difference among the
three subsets is the size of the total charge collected on the CGCD.
| 
|
| (a) | (b)
|
Figure 3:
Plot of the fraction of the charge on the center tap versus fine
position for events showing the effect of ringing on the fine positions.
In (a) the subset is selected from the lower end of the pulse height range
affected by the ringing.
In (b) the subset is selected from the upper end of the pulse height range
affected by the ringing.
In both of the latter two subsets, the locus of points on the positive fine
position side follows the same curve as the data displayed in
figure 2, while most of the events on the negative
side are systematically off of the hyperbola that describes the shape
of good positions.
Moreover, there are differences between these two subsets in their
deviations from the locus of good points which depend on the size
of the signal measured on the grid.
One difference between the two to note is that the fine position at
which the discontinuity off of the curve occurs becomes more negative
as the pulse height increases.
This effect can be explained by the fact that the ringing requires
there to be an even number of taps exceeding a threshold and larger
signals allow the events to occur farther away from the center of the
tap before the number of taps above threshold changes from three to two.
The event data plotted in figures 2 and
3 has already been somewhat processed; better insight
into how the data is being corrupted can be obtained by plotting raw
tap data.
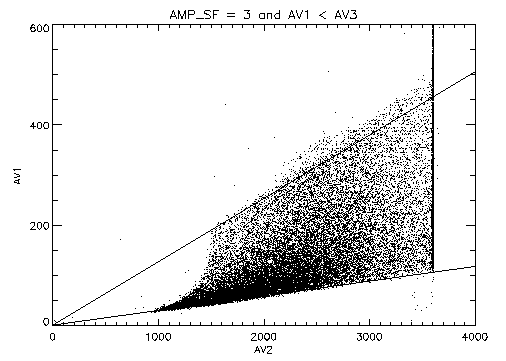
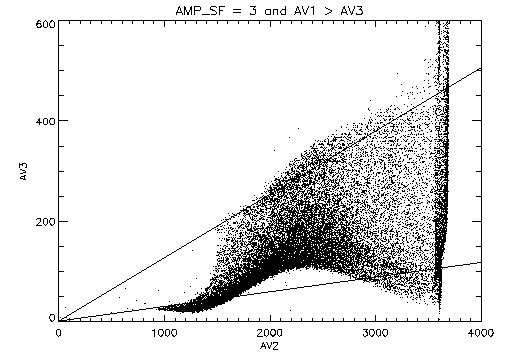
Figure 4 is a scatter plot of V-axis tap values from a
subset of the events on the least sensitive amplifier scale.
| 
|
| (a) | (b)
|
Figure 4:
V-axis tap values:
a) Left tap (AV1) vs center tap (AV2) for events that occur to the
right of the center tap.
b) Right (AV3) tap vs center tap (AV2) for events that occur to the
left of the center tap.
The solid lines from the origin show the expected linear relationship
between the tap values at the center and edge of the tap as
the signals increase in amplitude.
A sinusoidal pattern caused by the amplifier ringing is clearly
evident in panel b.
In telemetry processing, the V-axis tap signals are given the names
AV1, AV2, and AV3, where AV2 is the signal from the coarse position
tap, i, and AV1 and AV3 are the signals from the i-1 or left and
i+1 or right taps respectively.
Corresponding name assignments are given to the telemetered U-axis tap
signals.
The events in figure 4a are not affected by the
ringing in the amplifier, while those in figure 4b
are.
The corruption of the right side tap data for events occurring on the
left (negative) side of the tap can be seen as the sinusoidal pattern
relative the expected linear relationship with increasing amplitude.
It is not initially obvious why a damped ringing of the amplifier
signals should introduce a sinusoidal distortion.
If the sampling occurs at a fixed time after the tap selection is
switched, we would naively expect the size of the error to depend only
on the amplitude difference between the signals; the period and
decay-time constants should be fixed by resistances and capacitances in
the electrical circuit.
An examination of the data in figure 1 reveals that
the ringing is initially limited by the slew rate in the amplifier.
The slew-rate limitation introduces an amplitude dependent shift in
the phase of the oscillation at the time of sampling.
3.1 Sinusoidal Deviations
A better look at the sinusoidal distortion of the right tap signal can
be obtained by restricting the range of values of the left tap
relative to the central tap; this effectively restricts the events to
a limited range of fine positions.
With this selection of events it is also possible to remove the
expected linear trend between the two tap values and observe the
sinusoidal distortion directly.
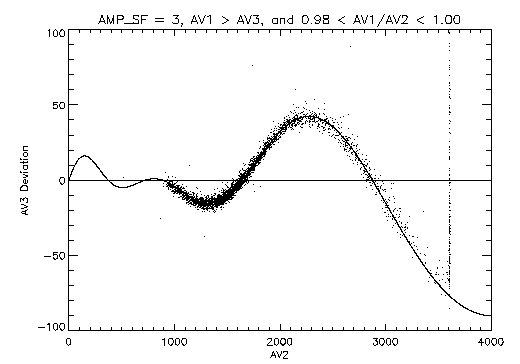
Figure 5 shows the AV3 deviations from the
expected value for only those events for which AV1/AV2 is in the range
0.98-1.00; these are the events near the negative edge of the tap
(fp ~= -0.5).
Figure 5:
Deviations of the corrupted AV3 tap signals from their expected values.
The events are selected to be from fp ~= -0.5 by having
AV1 » AV2.
The solid curve is an empirically derived sinusoid model for the
distortion.
The amplitude of the sinusoidal distortion increases as the size of
the center tap signal increases.
From the spacing between the sinusoid zero crossings, it is also
apparent that the period of the sinusoid increases with increasing
center tap signal.
We can empirically characterize the distortion with a sinusoid in which
the amplitude and period are linear functions of the center tap value:
|
Delta_AV3 = |
(
|
AV2 +b
a
|
)
|
sin |
(
|
2Pi |
AV2 - f
cAV2 + d
|
)
|
. |
| (2) |
The period function can be determined from the ``zero crossing'' points
of the deviations from the expected value.
There is a multiplicity in period solutions depending on the phase
adopted for the zero-crossing points (i.e. does the crossing at AV2
» 1640 correspond to 0.5, 1.0, 1.5,... cycles).
Once the period function is selected, the amplitude function can be
determined from the observed deviations at selected AV2 values,
correcting for the magnitude of the sine function.
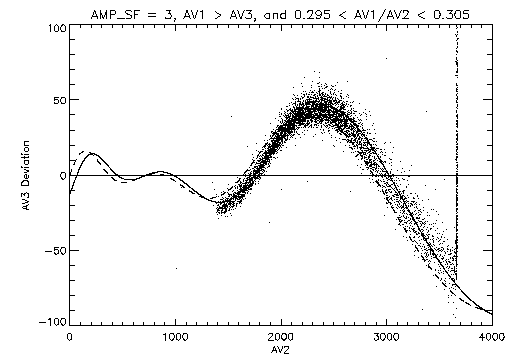
Figure 6 shows a plot similar to
figure 5 but for events with AV1/AV2 in the range
0.295-0.305.
Figure 6:
Deviations of the corrupted AV3 tap signals from their expected values.
The events are selected to have AV1/AV2 in the range 0.295-0.305.
The dashed curve is the same sinusoid as plotted in
figure 5.
The solid curve differs from the dashed curve only in the value of
f used in the sinusoid described in equation 2.
In this figure the sinusoid that is plotted with a dashed line is the
same as the one in figure 5; clearly, the
zero-crossing points have shifted.
The sinusoid plotted with a solid line differs from the one plotted
with a dashed line only by the value of f in
equation 2.
Since the zero-crossing points shift as AV1/AV2 changes, the sinusoid
should be modified by making f a function of AV1/AV2, f(AV1/AV2).
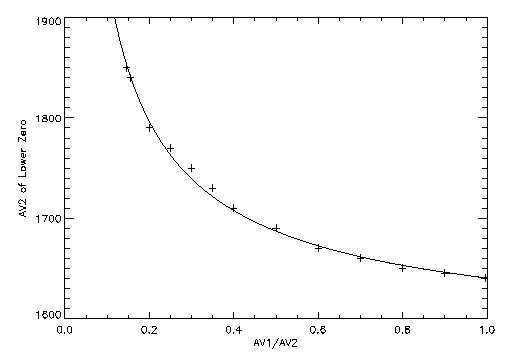
Figure 7 is a plot of the lower of the two
zero-crossing points as a function of AV1/AV2.
Figure 7:
V-axis sinusoidal deviation lower zero-crossing point as a function of
AV1/AV2.
The solid curve is a function of the form:
|
a+ b |
(
|
(
|
AV2
AV1
|
)
|
g
|
- 1 |
)
|
, |
| (3) |
The functional form of f(AV1/AV2) is the same this curve
but the constants a and b will change.
If we have determined the amplitude and period functions for the
sinusoid from the AV1/AV2 ~ 1 range while imposing the constraint
f = 0, then a will be forced to zero.
The value of b is modified by the choice of the phase of this
zero crossing point.
4 CORRECTION ALGORITHM
The sinusoid function determined above can be used to correct the
affected data on an event-by-event basis.
The events that are affected must meet the following conditions:
- AMP_SF = 3 (identifies least sensitive amplifier scale)
- A1 > A3 for the axis - one or both can be affected
- the signals on an even number of taps are above threshold
The last item in this list is the hardest condition to identify.
In order to avoid having too many taps trigger above threshold, the
value of the threshold used in the comparison is dynamic, changing
with the size of the signal from the bottom MCP.
Unfortunately, there is no direct measure of the size of the MCP
signal in the HRC telemetry; the closest things that we have available
are the event pulse height (determined from the total charge collected
on the CGCD) and the amplitudes of the tap signals.
An additional piece of data is available from the flight instrument:
there are a pair of status bits that indicate whether the event
exceeded a commandable event-width threshold, one bit for each axis.
This feature was implemented as an aid in identifying events that
are likely to have been generated by a charged particle.
The event width threshold has been set to 3 so that only for events
where the number of taps that are above threshold exceeds 3 on an axis
will its corresponding bit be set.
The ``width-threshold-exceeded'' bit is set for only a small fraction of
the events when the threshold value is 3.
We could lower the event-width threshold to 2 and use the setting of
these bits as an aid in identifying the events that require correction
but we still need to develop a criterion that will select between
events with two or three taps above threshold for use with data taken
prior to changing the threshold.
Since we have the freedom to modify the laboratory version of the
electronics, we have converted some unused status bits to flag events
for which the initial candidate coarse position was incorrect.
We hope to use the laboratory data with this modification to determine
which relationships among the tap signals and pulse height provide the
best chance of discriminating between events with two and with three
taps above threshold; however, this work is not yet complete.
Even guided by the results from laboratory tests, we must still
examine the data from the flight instrument to 1) judge the
applicability of the relationships to the flight data and 2) to
determine the specific values to be used in any comparisons.
As a start and without the benefit of guidance from laboratory data,
we have examined the flight data with the goal of find a simple
relationship between tap values that will provide the necessary
discrimination.
A selection that we have found that identifies most of the events that
require correction, without including too many that do not, is to choose
events for which A1/A2 > constant.
Once the affected events are identified, the corrupted tap values can be
corrected.
Combining the forms of equations 2 and 3
results in an equation for correcting the value of the right side tap:
|
A3corrected = A3telemetered - |
(
|
A2 + b
a
|
)
|
sin |
(
|
2Pi |
cA2 + d
|
)
|
|
| (4) |
We determined the coefficients used to correct the data from the HRC-I
and HRC-S using calibration observations of the supernova remnant
Cas-A.
Using a large diffuse target allows us to sample the behavior of the
signals on a large number of taps.
Only the coarse positions containing X-ray events from the remnant
were used, a 10 tap by 10 tap region.
The derived coefficients are listed in table 1.
Table 1:
Sinusoid Correction Coefficients
| HRC-I | HRC-S |
| Coefficient | V-axis | U-axis | V-axis | U-axis |
| a | -35.3 | 20.0 | -40.0 | -24.0 |
| b | -728.0 | -740.0 | -655.0 | -690.0 |
| c | 0.278 | 0.241 | 0.279 | 0.279 |
| d | 638.0 | 979.0 | 655.0 | 530.0 |
| e | 50.0 | 12.0 | 0.0 | 6.7 |
| g | 0.7 | 2.0 | 1.0 | 1.75 |
| A1/A2 threshold | 0.14 | 0.20 | 0.20 | 0.20 |
As a test of the correction given by equation 4 and
the coefficients in table 1, we applied them to the
calibration observation of the bright source 3C273.
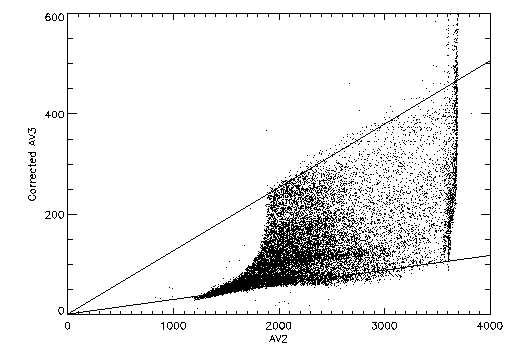
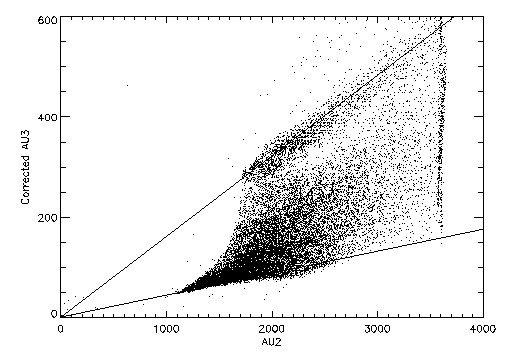
Figure 8 display the events from the negative
side of the V-axis and U-axis taps with the corrections applied to the
affected events; in both cases the sinusoidal distortion is greatly
diminished.
| 
|
| (a) | (b)
|
Figure 8:
Right tap versus center tap values after applying corrections:
a) V-axis (can be compared to figure 4b).
b) U-axis
Once the tap data have been corrected, event positions in the detector
and their corresponding locations on the sky can be calculated.
As mentioned in section 2, the fine position
calculated via equation 1 must be modified to account for
the information lost due to incomplete charge collection when only
three tap signals are used[13].
This degapping correction essentially determines the event location
relative to the center of the tap using a polynomial in fp.
Chappell and Murray (1989)[13] showed that a second order
polynomial degap correction should be sufficient to correctly position
the events to better than one pixel.
A fifth-order polynomial has been used in most of the standard
processing of HRC data.
Such a high order polynomial was adopted in an attempt to correct for
the effects of the amplifier ringing.
Unfortunately, the fifth-order coefficients were derived from data
from the entire width of the detector and as a result do a poor job of
correcting for the distortions that are present at any localized area
of the detector.
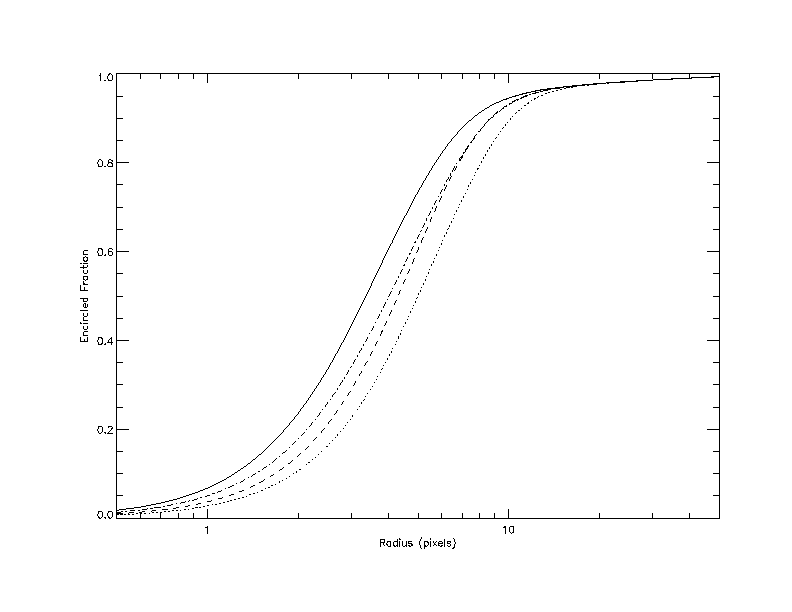
Figure 9 shows the encircled energy fraction from
the core of 3C273; four curves are presented for cases with and
without correcting the tap data for amplifier ringing and using linear
or fifth-order degapping corrections.
Figure 9:
Encircled energy fraction for the core of 3C273 as a function of
radius in HRC pixels (1 pixel is ~ 0.132 arcseconds).
The solid curve is generated from tap data that have been corrected and
positions calculated using linear degapping correction.
The dashed curve is generated from tap data that have been corrected and
positions calculated using fifth-order degapping correction.
The dot-dashed curve is generated from tap data that have not been
corrected and positions calculated using linear degapping correction.
The dotted curve is generated from tap data that have not been
corrected and positions calculated using fifth-order degapping
correction.
The solid curve and the dot-dashed curve best show the improvement
in image quality that results from correcting the tap values; the 50%
encircled-energy radius decreases from 4 to 3.2 pixels
5 CONCLUDING REMARKS
The empirically derived algorithm for correcting the data from the
CGCD taps that we have presented in this paper reduces the blurring in
images introduced by the amplifier ringing.
The removal of distortions from the tap signals is not complete and
the identification of the effected events is imperfect.
One complication that has been ignored in the derivation of the
algorithm is that all three tap signals on an axis are affected by
the amplifier ringing problem when it occurs.
The signature is not as apparent for the two larger signals but since
the size of the correction factor is determined from their values some
of the residual distortion may be due to distortions within these
signals.
Similarly, the identification of the affected events can be confused
by distortions in these other signals.
However, given the demonstrated improvement in image quality, the correction
algorithm presented in this paper has been incorporated into the
Chadra X-ray Center standard processing software and will be used in
re-processing of the data taken since the start of the mission and for
the processing of future data.
Acknowledgements
This work has been supported by NASA contracts NAS8-39073 and
NAS8-38248.
References
- [1]
- Weisskopf, M. C., Tananbaum, H. D., Van Speybrock, L. P.,
and O'Dell, S. L., ``Chandra X-Ray Observatory (CXO): Overview'',
Proc. SPIE 4012, 2000.
- [2]
- Jerius, D., Edgar, R. J., Gaetz, T. J., McNamara, B. R.,
Schwartz, D. A., Van Speybroeck, L. P., Zhao, P., ``Orbital
measurement and verification of the Chandra X-ray Observatory's PSF'',
Proc. SPIE 4012, 2000.
- [3]
- Garmire, G. P., Burrows, D., Feigelson, E., Nousek, J.,
Canizares, C., Clark, G., Collins, S. A., Morrison, J., Pravdo, S. H.,
Riegler, G. R., ``The AXAF CCD imaging spectrometer'', Proc. SPIE 597,
261, 1986.
- [4]
- Bautz, M. W., Baganoff, F., Isobe, T., Jones, S. E.,
Kissel, S. E., LaMarr, B., Manning, H. L., Pivovaroff, M., Prigozhin,
G. Y., Nousek, J. A., Grant, C. E., Nishikida, K., Scholze, F.,
Thornagel, R., Ulm, G., ``X-ray CCD calibration for the AXAF CCD
imaging spectrometer'', Proc. SPIE Vol. 3444, 210, 1998.
- [5]
- Murray, S. S., Austin, G. K., Chappell, J. H.,
Gomes, J. J., Kenter, A. T., Kraft, R. P., Meehan, G. R., Zombeck,
M. V., Fraser, G. W., and Serio, S., ``In-flight performance of the
Chandra high-resolution camera'', Proc. SPIE 4012, 2000.
- [6]
- Markert, T. H., Canizares, C. R., Dewey, D., McGuirk,
M., Pak, C. S., Schattenburg, M. L., ``High-Energy Transmission
Grating Spectrometer for the Advanced X-ray Astrophysics Facility
(AXAF)'', Proc. SPIE 2280, 168, 1994.
- [7]
- Brinkman, A. C., Gunsing, T., Kaastra, J. S., van der
Meer, R., Mewe, R., Paerels, F. B., van Rooijen, J., Bruninger, H. W.,
Burwitz, V., Hartner, G. D., Kettenring, G., Predehl, P., Dewey, D.,
Marshall, H. L., Chappell, J. H., Drake, J. J., Johnson, C. O.,
Kenter, A. T., Kraft, R. P., Meehan, G. R., Murray, S. S., Ratzlaff, P. W.,
Wargelin, B. J., Zombeck, M. V., ``Description and performance of the
low-energy transmission grating spectrometer on board Chandra'',
Proc. SPIE 4012, 2000.
- [8]
- Kenter, A, Chappell, J. H., Kraft, R., Meehan, G.,
Murray, S. S., Zombeck, M., Hole, K. T., Juda, M., Donnelly, R. H.,
Patnaude, D., Pease, D., Wilton, C., Zhao, P., Austin, G., Fraser, G.,
Pearson, J., Lees, J., Brunton, A., Barbera, M., Collura, A., and
Serio, S, ``In-flight Performance and Calibration of the Chandra High
Resolution Camera Imager (HRC-I)'', Proc. SPIE 4012, 2000.
- [9]
- Kraft, R. P., Chappell, J. H., Kenter, A. T., Meehan,
G. R., Murray, S. S., Zombeck, M. V., Donnelly, R. H., Drake, J. J.,
Johnson, C. O., Juda, M., Patnaude, D. O., Pease, D., Ratzlaff, P. W.,
Wargelin, B. J., Zhao, P., Austin, G. K., Fraser, G. W., Pearson,
J. F., Lees, J. E., Brunton, A. N., Barbera, M., Collura, A., and
Serio, S, ``In-flight Performance and Calibration of the Chandra High
Resolution Camera Spectroscopic Readout (HRC-S)'', Proc. SPIE 4012, 2000.
- [10]
- Murray, S. S., Chappell, J., Kenter, A., Juda, M.,
Kraft, R., Zombeck, M., Meehan, G., Austin, G., and Gomes, J., ``Event
Screening for the Chandra X-Ray Observatory High Resolution Camera
(HRC)'', Proc. SPIE 4140, 2000.
- [11]
- ``Chandra Inflight Status Report'',
http://asc.harvard.edu/udocs/status.html
- [12]
- Murray, S. S. and J. H. Chappell, ``The Advanced X-ray
Astrophysics Facility High Resolution Camera'', Proc. SPIE, 982, 77, 1988.
- [13]
- Chappell, J. H. and S. S. Murray, ``Position Modeling
for the AXAF High Resolution Camera (HRC)'', Proc. SPIE, 1159, 460, 1989.
- [14]
- Murray, S. S., Chappell, J. H., Kenter, A. T.,
Kobayashi, K., Kraft, R. P., Meehan, G. R., Zombeck, M. V., Fraser,
G. W., Pearson, J. F., Lees, J. E., Brunton, A. N., Pearce, S. E.,
Barbera, M., Collura, A. and Serio, S., ``AXAF High-Resolution Camera
(HRC): calibration and recalibration at XRCF and beyond'', Proc. SPIE,
3114, 11, 1997.
File translated from
TEX
by
TTH,
version 2.65.
On 13 Dec 2000, 09:19.
