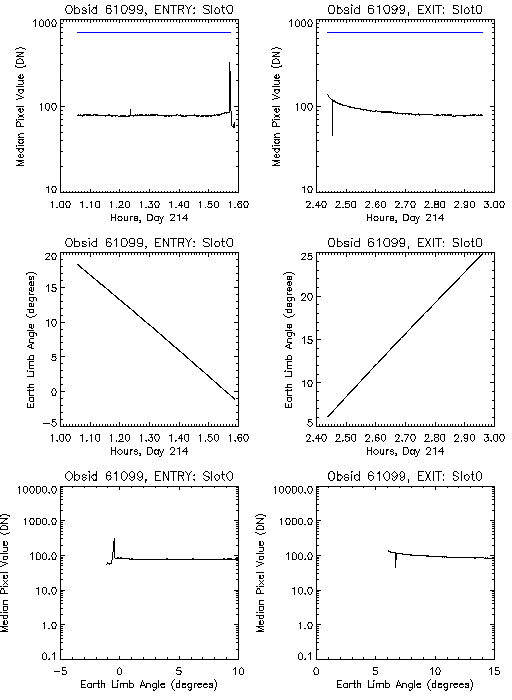
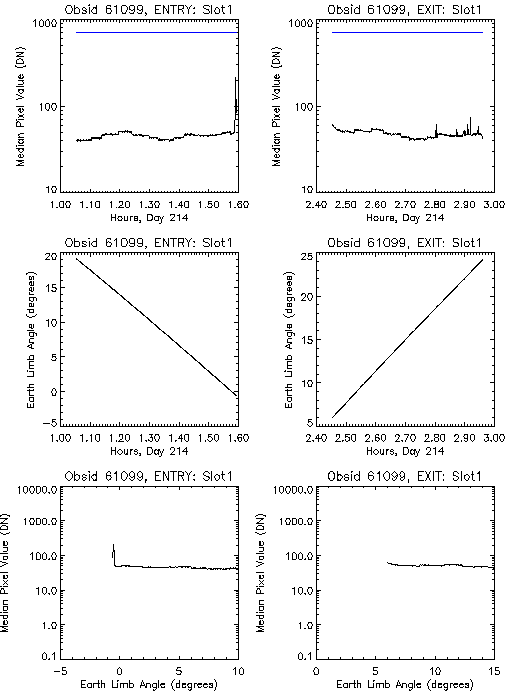
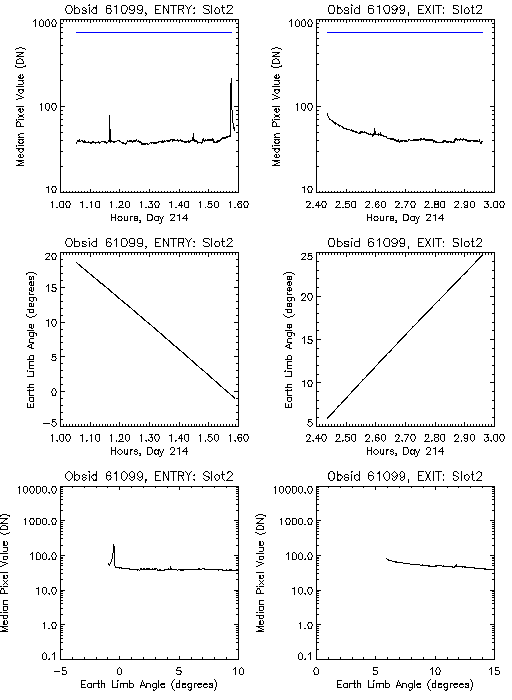
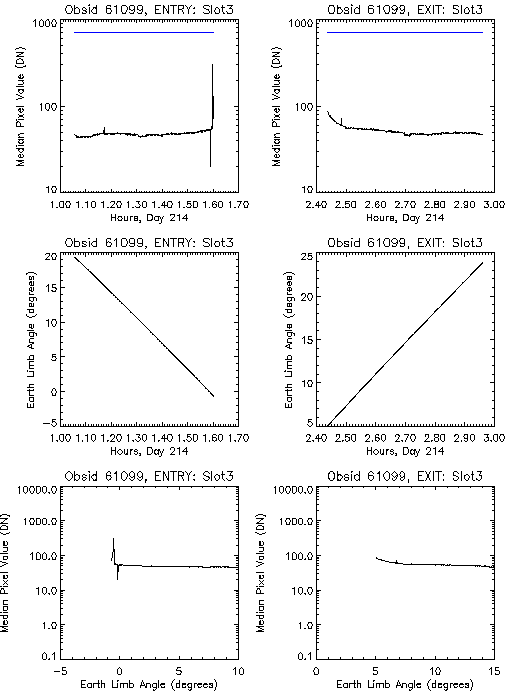
Individual ACA Image Slot Analysis Details
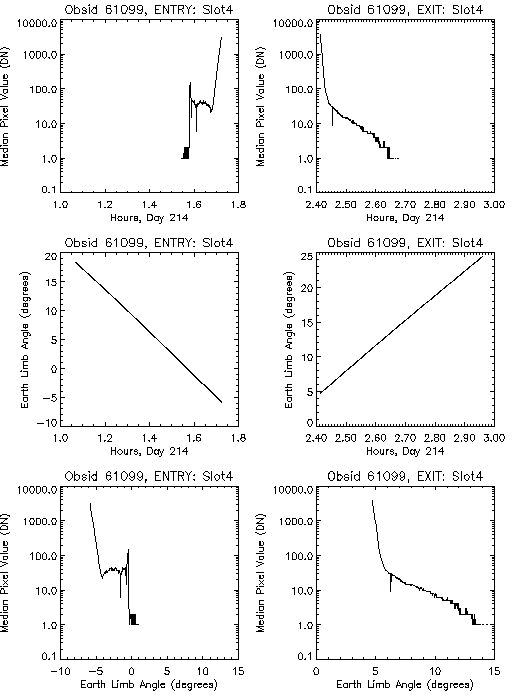
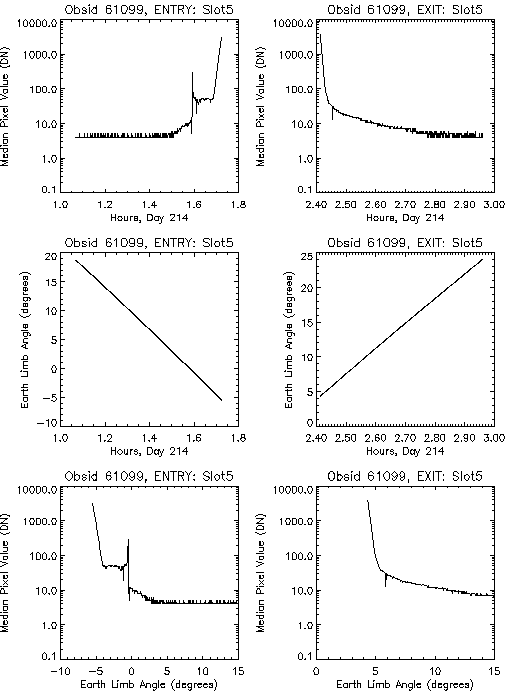
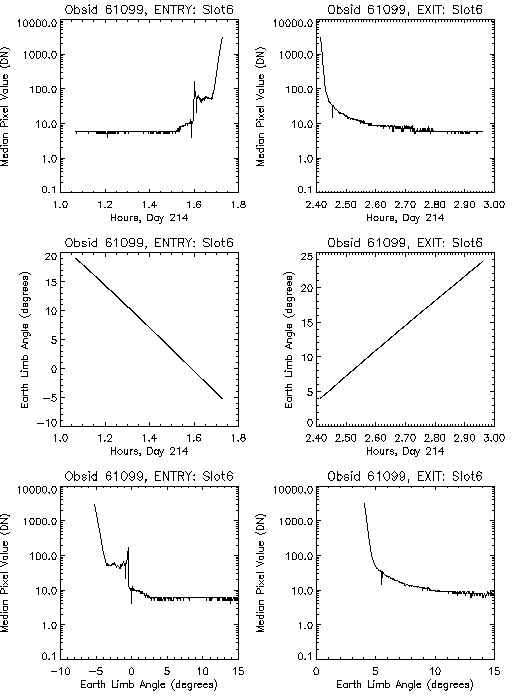
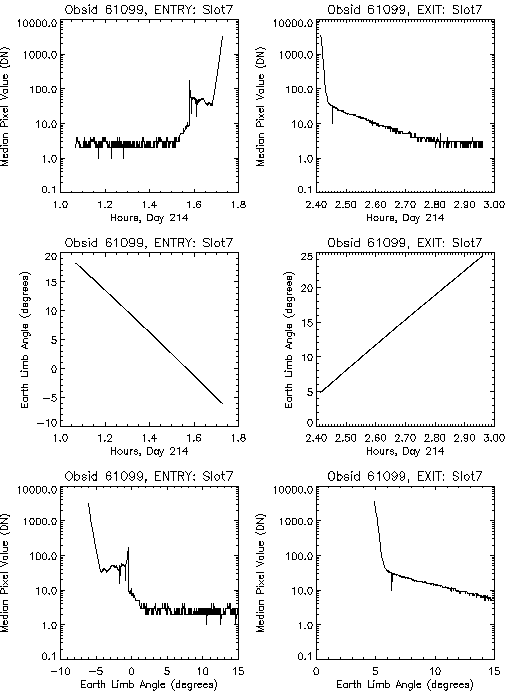
Separate data for the occultation entry and exit for each ACA image slot are shown below. The plots below show the time histories of the median or average pixel value and Earth limb angle for each image slot, and the variation of the median or average pixel value with Earth limb angle.For the stars, the blue lines show the time periods when the ACA reports that it is tracking an image. The stars are tracked all the way to the edge of the dark Earth.
Every image slot shows a small spike in intensity at a limb angle of -0.5 degrees.
The cause of this intensity spike is not known for certain, but may be
due to refraction of sunlight around the dark limb.
Last modified: 2002-August-09