Summary
During a COMM pass on 2001:126 the background level(Figure 1) in ACA images was observed to be anomalously high for a period of about 100 seconds. Near the end of this interval two of the five guide stars were lost for 30-40 seconds as the star flux was overwhelmed by the high background. ACA telemetry for nearly the entire mission has now been examined to search for other similar events and to attempt to determine the cause. Approximately 17 high background events have occurred, most of them (13) since 2001:126. The most severe occurred on 2001:185, when five out of eight guide stars were lost for over 60 seconds. As yet there is no clear explanation for these anomalies. This report presents the following:- Method for extracting high background events
- Characterization of high background events
- Catalog of anomalous high background events
- Fault tree (courtesy RAC)
- Discussion and comments
Method for extracting high background events
The list of high background events for the mission was generated in the following way:- Download all ACA Level-0 telemetry (i.e. ACA image telemetry) within the time period 1999-09-27 to 2001-07-31, one day at a time
- Extract relevant items within the ACA L0 telemetry such as average background, slot, and image status bits. These were highly compressed by storing only transitions, such as when a status bit flips or the background changes by more than 10 DN. Without this compression the data volume would be too great.
- A high background event is then defined by the following criteria:
- An initial threshold crossing where the background in one slot is greater than 200 DN for one readout
- Within the time interval (-100 : +300) seconds relative to the threshold crossing, calculate the total "slot-seconds" in which background > 100 DN, summing over all slots tracking stars or fids.
- If this summed high background duration is greater than 20 seconds, flag a high background event and produce a plot.
Characterization of high background events
The majority of high background events defined this way fall into three categories (see below for an explanation of the plots):- Displaced star (Figure 2), due to ionizing radiation, in which the star is in the "Lost, attempting to re-acquire" state for up to 120 seconds. During this time the star is offset by several pixels from the readout window center, thus causing the high background value. It is not immediately clear why the ACA fails to reacquire the star, nor why the OBC does not issue a new search command for the star. Hopefully Ball and TRW/FOT can shed light on these questions.
- Bombardment by ionizing radiation
(Figure 3)
during perigee causing displaced star and numerous short loss-of-track
events
- Anomalous high background (Figure 1) in which the star remains in solid lock at the window center, but the background appears to rapidly flicker up and down. The event shown here is the prototype high background event.
- Accidental Earth transit (Figure 4)
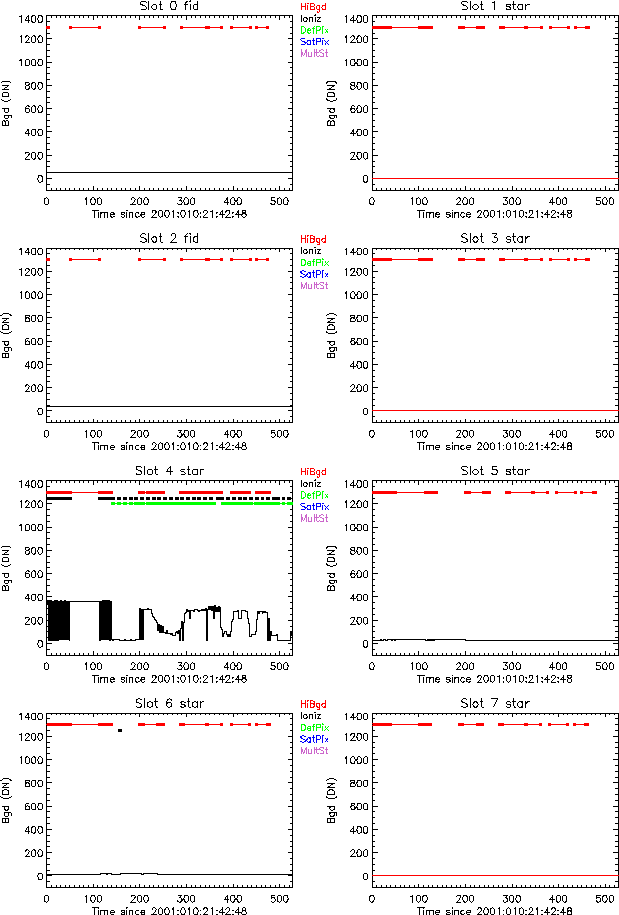
- Venus observation (Figure 5): this is a snippet of a long period in which slot 4 had high background and was being lost from time to time
Catalog of anomalous high background events
Postscript plots showing the background rate and various status bits for periods of anomalous high background are available for 1999, 2000, and 2001,. The same plots are available as GIF files in the table below. In each plot, the horizontal axis shows time in seconds, and vertical shows the background in DNs as reported by the ACA in image telemetry. When the background trace is black, the star/fid is being tracked. When it is red, the star/fid is in the "Lost, attempting to re-acquire" or "Idle" state. In addition, a color "strip chart" at the top of each plot indicates when ACA status bits are set. The bits which are plotted are High Background (red), Ionizing Radiation (black), Defective Pixel (green), Saturated Pixel (blue), and Multiple Stars (Magenta).The table below shows details for each high background event. The final column shows the number of stars in which tracking was lost.
      Date         Obsid   High time       RA       Dec    Roll    # LOT
-----------------  -----   ---------    --------  ------- ------   -----
1999:310:02:31:14  400       32.8000    185.7445  15.8163  49.12       0
2000:052:19:30:49  344       22.5500     40.6514  -0.0028 281.64       0
2000:188:18:15:39  Perig     22.5500    334.1500  56.5500 136.47       0
2000:331:05:45:58  Perig     55.3500    208.5200  69.3800  31.25       0
2001:126:13:08:46  Perig     660.098    280.0000  25.0000 121.19       1
2001:126:22:17:36  Perig     344.400    232.0000  18.0000 166.64       3
2001:170:02:42:56  977       38.9500    271.1116 -24.3781  80.36       0
2001:170:04:49:06   "        32.8000       "        "        "         0
2001:170:06:05:36  2264      32.8000    311.8162 -36.4910  83.43       0
2001:176:19:12:16  Perig     65.6000    350.0000  30.0000 117.35       2
2001:182:10:27:16  Perig     399.750    295.0000 -30.0000  65.32       3
2001:182:10:32:26    "       153.750        "        "       "         3
2001:182:11:16:56    "       47.1500        "        "       "         2
2001:185:02:23:06  Perig     299.300    324.0000 -46.0000  68.94       5
2001:200:22:57:16  Perig     24.6000    289.0000 -37.0000 328.23       0
2001:200:23:40:56    "       22.5500       "         "      "          0
2001:202:22:01:46  2144      305.450    265.9912  27.9049 219.19       0
Fault tree
Rob Cameron has created the following fault tree: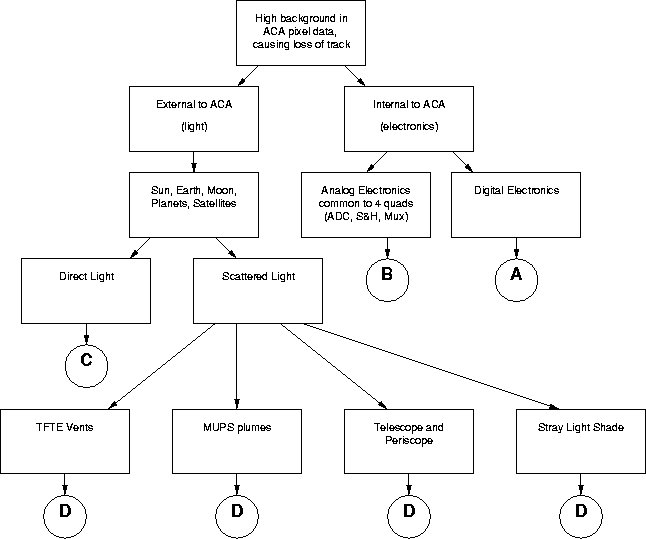
- A: Digital Electronics: not a likely cause, since the digital electronics processing of ACA data is common to all images, and the high background only affects some images.
- B: Saturation effects:While saturation effects can occur in the analog electronics common to all 4 CCD quadrants, Ball Aerospace has stated that these effects only persist for short amounts of time, i.e. the sampling and digitization of 1 or 2 unsaturated pixels may be affected by the immediately previous sampling and digitization of saturated pixels. Since high background events can affect multiple images over several readouts, analog electronics saturation is unlikely to be the cause.
- C: Direct Light: test for Sun, Earth, Moon, Planets in the ACA field of view at the time of high background. Of the planets, only Venus and perhaps Jupiter would be capable of affecting the background measurement in several image slots across different quadrants. Some satellites might be bright enough to saturate the ACA, but would presumably have small angular offsets from the Earth.
- D: Scattered light: correlate episodes of high background against (theta,phi) coordinates relative to the ACA line of sight, to try to identify scattering paths. Also correlate episodes of high background against angular sizes (i.e. distances to) Earth and Moon. Also correlate episodes of high background against times of firing of MUPS thrusters, in case light can be scattered into ACA by MUPS exhaust plumes.
Discussion and comments
- To date, none of the high background events have resulted in an anomalous transition out of NPM because of lost guide stars. Nevertheless, several instances have come uncomfortably close. Until we gain a more complete understanding of the root cause, it is important to schedule as many guide stars as possible during perigee.
- Most of the high background events (and all of the severe ones) occurred during perigee. This might be due to increased ionizing radiation, or perhaps scattered light from the relatively large Earth. Carrying out the correlation suggested in path D of the fault tree is an important next step to the investigation.
- Most of the high background events have occurred within the last six months. This might indicate some sort of degradation. Is it possible the particle radiation environment (during perigee) is worse now than in most of 2000?
- One possible diagnostic measure would be to track all guide stars using 8x8 readout windows during perigee passage. This would have no impact on spacecraft control nor CXC processing, but would provide important diagnostic ACA telemetry.
- The similar signature of the Venus observation background to several of the anomalous high background events could be an important clue.
- A monitoring system to catch high background events should be put in place. This can be done with slight modifications to the existing software used to prepare this report.
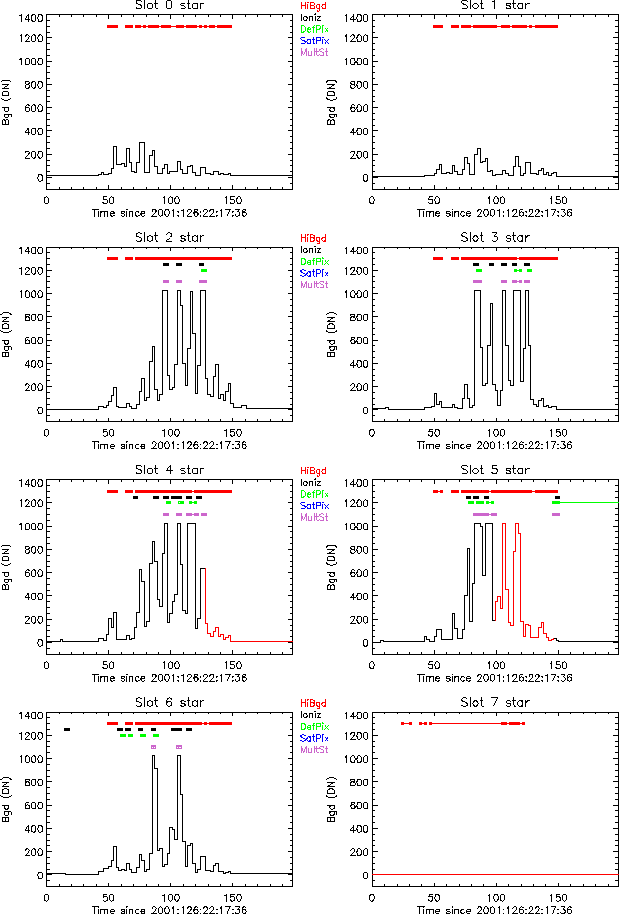
Figure 2
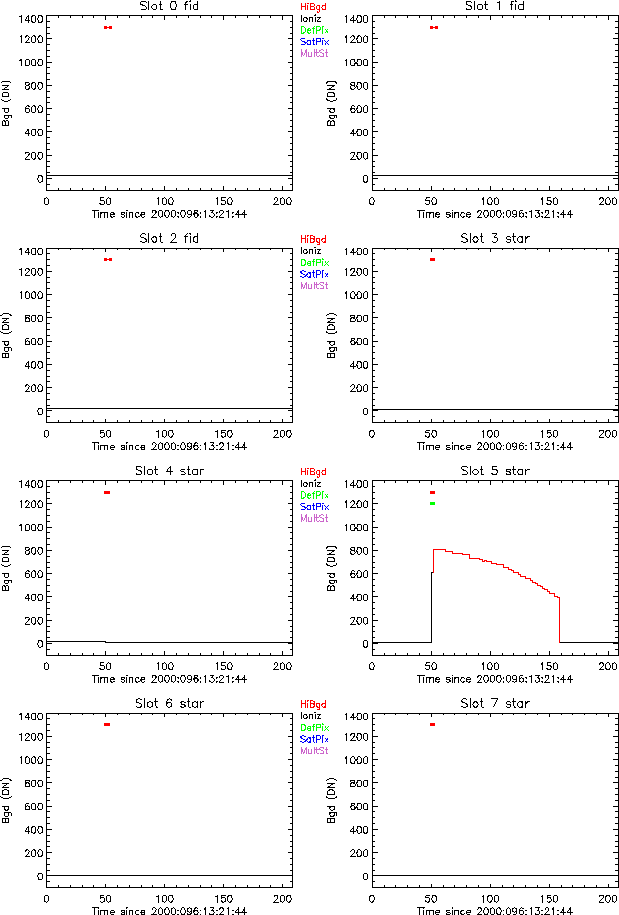
Figure 3
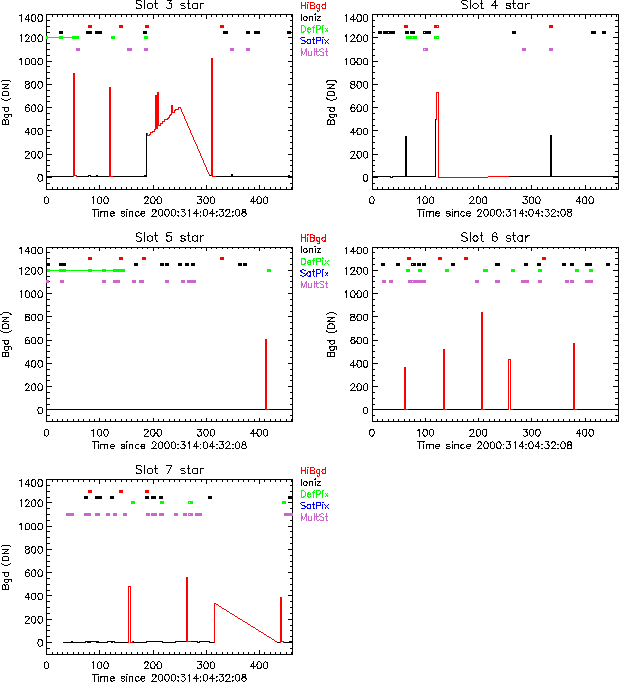
Figure 4
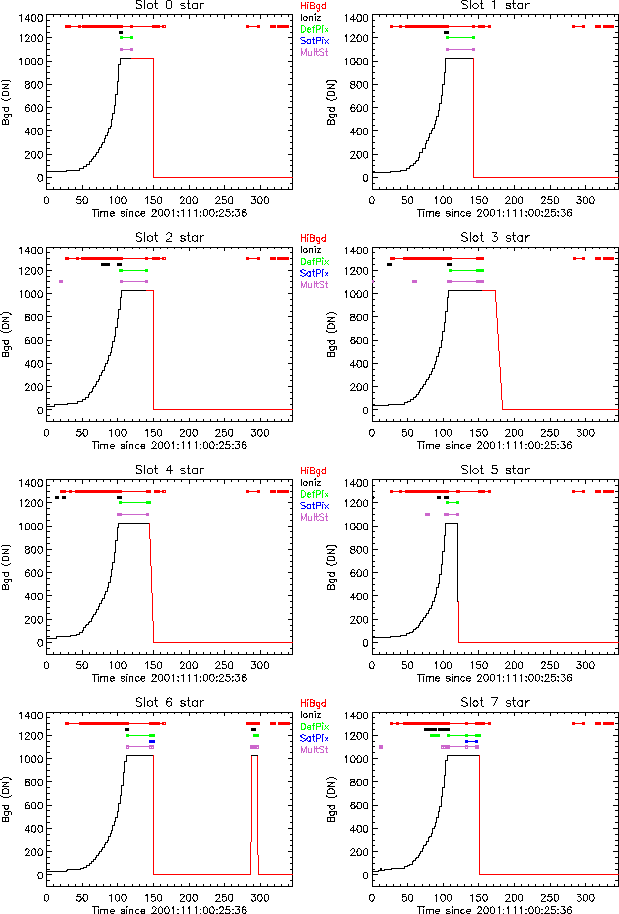
Figure 5

Aspect Information main page
Comments or questions: Tom Aldcroft
Last modified:05/13/02