Dark current calibration summary 2019-06-28
Date (mean): 2019:179:22:51:52
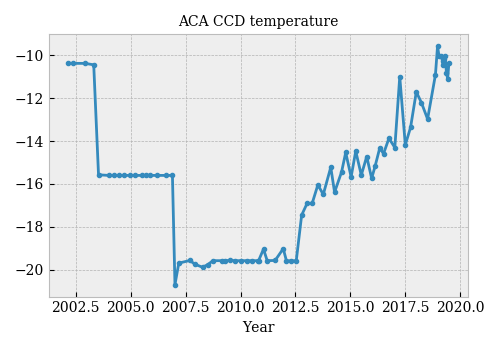
T_ccd (mean): -10.36 C
CCD readouts summary
The table below provides the number of pixels which have the specified
number of readouts. This quantifies how many pixels have been
excluded either by star masking or because an entire quadrant readout is
missing due to lost telemetry.
| readouts | n_pixels |
|---|
| 10 | 240 |
| 11 | 2 |
| 12 | 24512 |
| 13 | 103 |
| 14 | 1023719 |
The table below summarizes each of the 1024x1024 CCD readouts that
were used to create the calibration image. Note that each readout
is stitched together from four quadrant readouts that are not
synchronous in time. This is reflected in the quad dt
column which shows the min and max delta time from the mean.
| date | quad dt (sec) | t_ccd | int_time(s) | n_masked |
|---|
| 2019:169:12:22:40 | -129 to +70 | -13.29 | 5.0 | 717, 977, 871, 697 |
| 2019:169:12:23:20 | -149 to +70 | -13.29 | 10.0 | 716, 978, 872, 696 |
| 2019:177:03:46:40 | -129 to +70 | -11.73 | 5.0 | 912, 944, 1013, 1000 |
| 2019:177:03:47:20 | -139 to +71 | -11.73 | 10.0 | 914, 941, 1013, 1000 |
| 2019:182:12:54:18 | -79 to +45 | -9.50 | 5.0 | 751, 838, 898, 1069 |
| 2019:182:12:58:58 | -180 to +90 | -9.50 | 10.0 | 750, 837, 897, 1072 |
| 2019:182:13:37:17 | -79 to +46 | -9.50 | 5.0 | 706, 857, 872, 1034 |
| 2019:182:13:41:58 | -180 to +89 | -9.50 | 10.0 | 705, 856, 875, 1032 |
| 2019:182:14:20:18 | -80 to +44 | -9.50 | 5.0 | 720, 972, 895, 1090 |
| 2019:182:14:24:58 | -180 to +90 | -9.50 | 10.0 | 719, 974, 895, 1091 |
| 2019:182:15:03:18 | -79 to +45 | -9.50 | 5.0 | 741, 970, 918, 1096 |
| 2019:182:15:07:58 | -180 to +90 | -9.50 | 10.0 | 742, 970, 919, 1097 |
| 2019:182:15:46:17 | -79 to +45 | -9.50 | 5.0 | 726, 870, 895, 993 |
| 2019:182:15:50:58 | -180 to +90 | -9.50 | 10.0 | 728, 872, 896, 994 |
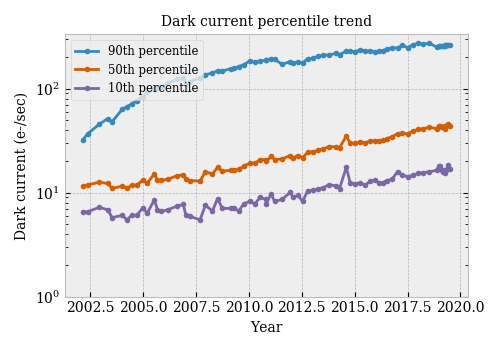
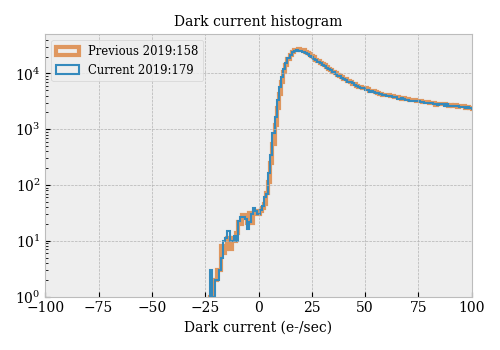
Plots (all scaled to -10 C)


Reference information
See the legacy
dark current calibration pages for useful information.


