 |  |
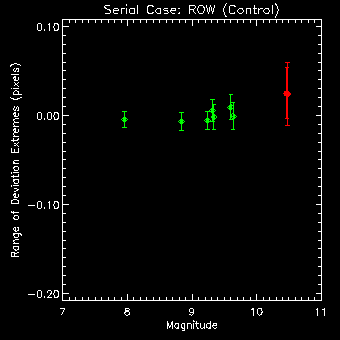
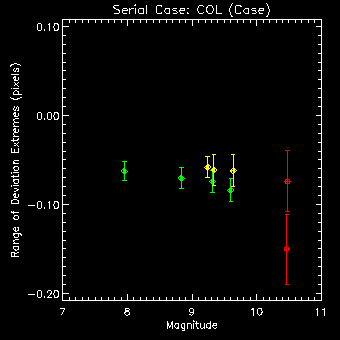
| OBSID | MAG | RMSMAG | Δr (Control) | σ Δr | Δc (Case) | σ Δc | Mean Row | Mean Col |
| 60243 | 7.9508 | 0.0154 | -0.0047 | 0.0091 | -0.0627 | 0.0104 | -272.0 | -0.4 |
| 60239 | 8.8348 | 0.0141 | -0.0066 | 0.0098 | -0.0705 | 0.0115 | 398.6 | -0.3 |
| 60261 | 9.2411 | 0.0137 | -0.0057 | 0.0105 | -0.0583 | 0.0118 | -202.4 | -0.5 |
| 60223 | 9.3161 | 0.0155 | 0.0054 | 0.0126 | -0.0743 | 0.0125 | -410.0 | -0.4 |
| 60245 | 9.3363 | 0.0161 | -0.0019 | 0.0138 | -0.0612 | 0.0175 | 368.4 | -0.6 |
| 60222 | 9.5988 | 0.0156 | 0.0093 | 0.0142 | -0.0840 | 0.0132 | -378.4 | -0.3 |
| 60241 | 9.6370 | 0.0245 | -0.0008 | 0.0150 | -0.0621 | 0.0178 | 305.8 | -0.5 |
| 60270 | 10.4673 | 0.0325 | 0.0249 | 0.0285 | -0.1502 | 0.0393 | -204.6 | -0.5 |
| 60235 | 10.4788 | 0.0299 | 0.0241 | 0.0349 | -0.0740 | 0.0341 | -413.8 | -0.6 |
| Averages | 0.0049 | 0.0165 | -0.0775 | 0.0187 |

Aspect Information main page
Comments or questions: Aspect Help
Last modified:12/27/13