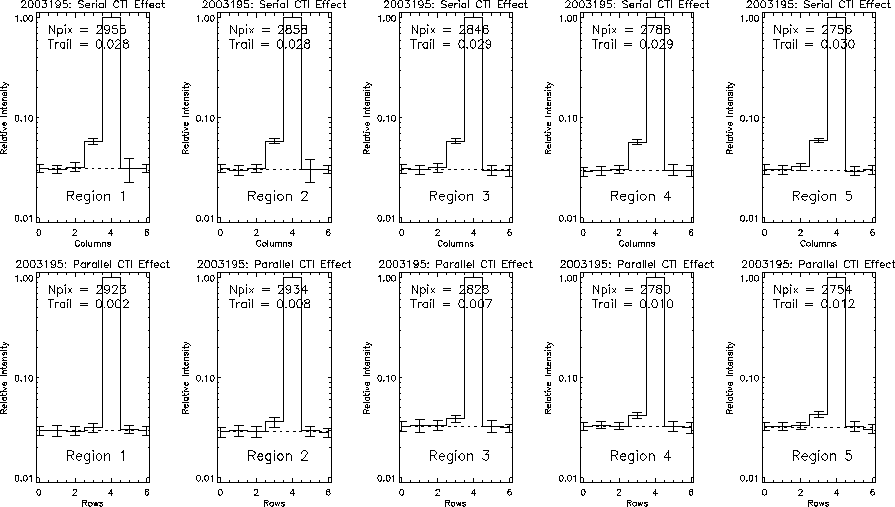
The median 7-pixel vector is displayed for each region, with the warm pixel in pixel 4. Each 7-pixel vector was normalized by the warm pixel value before median filtering was applied. The number of contributing warm pixels is shown as Npix on each plot. The error bar on each pixel is the error on the mean (= standard deviation/sqrt(Npix)) for the sample of values for that pixel.
The signal in the first trailing pixel behind the warm pixel is shown as
Trail, which is relative to the dark current baseline shown by the dotted line
under each vector. The baseline is determined from the average of the 2 leading pixels
(5 and 6) and the last trailing pixel (0).

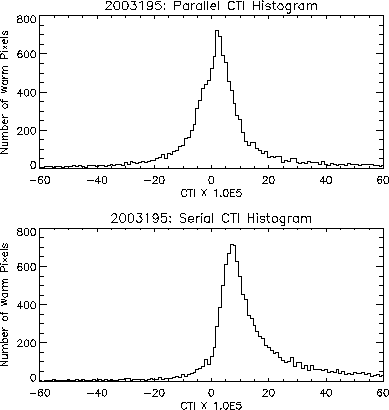
The following figure shows the distribution of CTI values measured for individual warm
pixels in the dark current calibration image. The peak of the serial CTI distribution
is clearly at a larger CTI than the peak of the parallel CTI distribution.
