Summary
The temperatures of the EPHIN assembly components (given by TEPHIN and 5EPHINT respectively) respond strongly to changes in the sun pitch angle. This report presents some simple phenomenology as inputs to the FOT effort to develop a thermal model that can accurately predict EPHIN temperatures. The key results are:- Most of the TEPHIN and 5EPHINT data can be simply modelled as single passive thermal element with an exponential trend toward a final temperature. The final temperature is a well-behaved function of pitch only.
- The thermal time constant for TEPHIN is NOT purely a function of pitch angle. In some cases there is a clear dependence on prior thermal history.
- Over the pitch range from about 70 to 130 degrees, the thermal timescale is reasonably predictable regardless of prior history. Outside that range the timescale at a particular pitch can vary by factors of two or more.
- The detector temperature (5EPHINT) appears to have a fairly short time constant (less than about 30 ksec) and is tightly coupled to the housing temperature. After the initial settling, 5EPHINT just follows TEPHIN with a constant offset that is pitch dependent.
Basic response to change in pitch
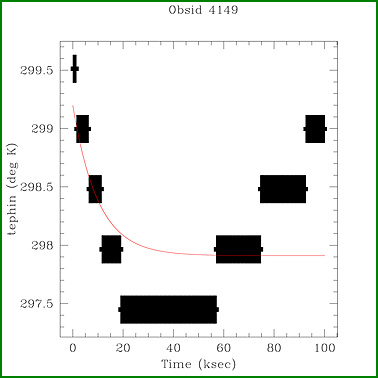
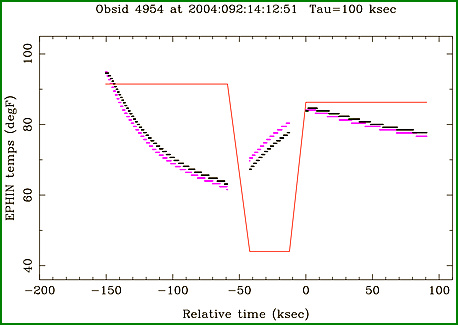
The plots below show two different responses in TEPHIN after a change in pitch. Both cases have been fit with a decaying exponential plus a constant. The amplitude and time constant of the exponential as well as the constant offset (i.e. limiting temperature) are free to vary. On the left side the fit is quite good, while on the right side it is evident that the system begins rewarming after a period of about 40 ksec of very fast cooling. The delta temperature in the latter case is only 2 C, so this effect is not energetically dominant; nevertheless it shows that there are non-negligible factors besides solar heating and radiative cooling.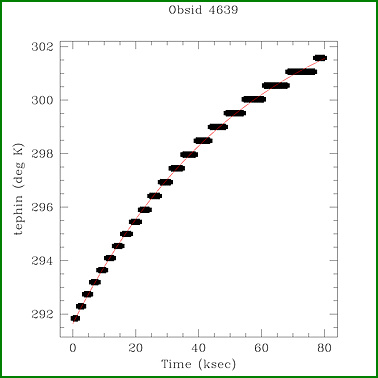
Evolution of timescales and limiting temperatures
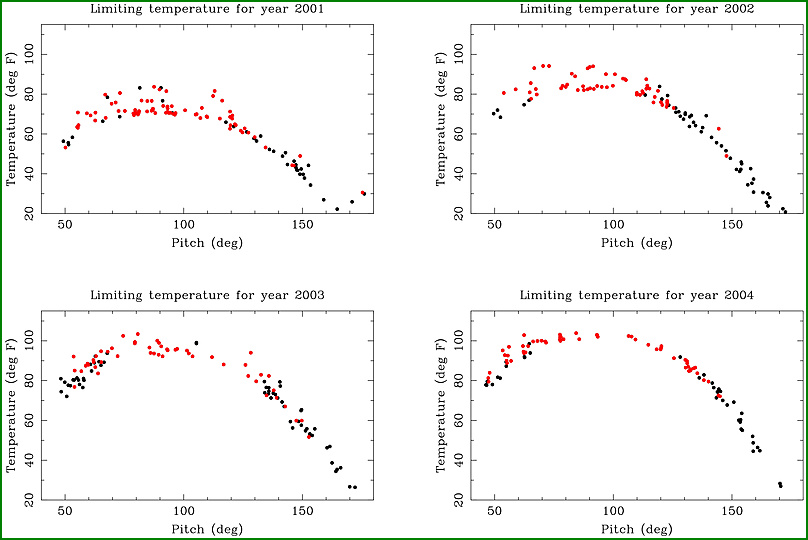
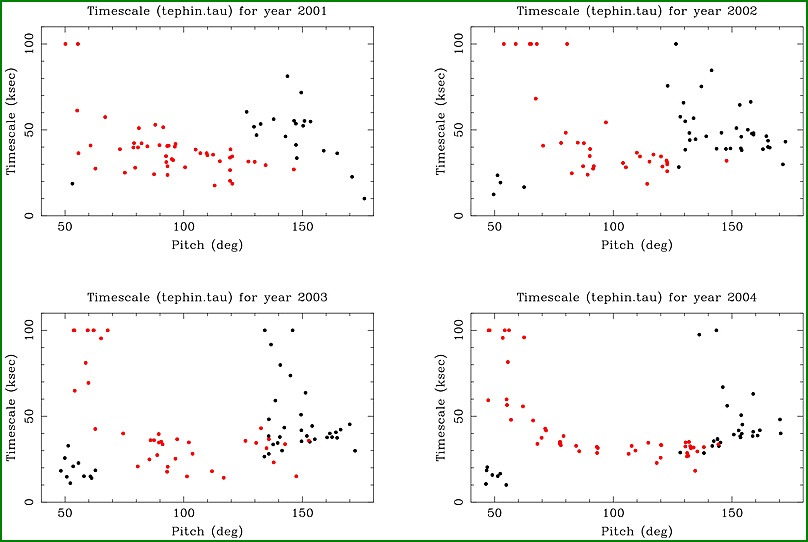
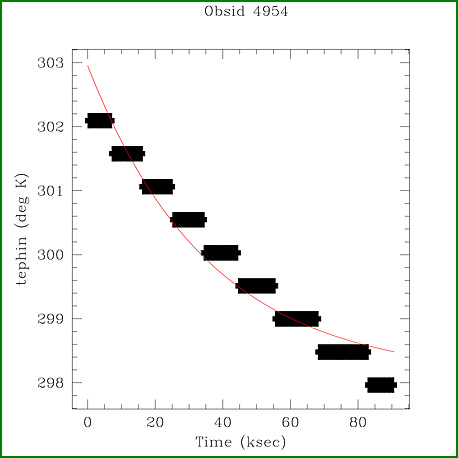
Despite the above example, in most cases the exponential model provides an adequate fit for the data and provides an estimate of the thermal timescale and limiting temperature. The plots below show fitted values for these parameters as a function of pitch angle, separated by year. (For now the roll angle is being ignored). The data are for dwells of at least 50 ksec where the temperature changed by at least 3 C. This allows a reasonably accurate fit. The black points show cases where the temperature is decreasing, while red points indicate an increasing temperature. For attitudes near pitch=90 in recent years, the temperature is always increasing, implying that the spacecraft had previously been at a cooler attitude.- For both the timescale and limiting temperature, it appears that the correlations with pitch get tighter in later data. This is curious, but may have to do with mission planning constraints to keep temperatures down.
- For year 2004, in the pitch range about 70 - 130 degrees, there is a reasonably good correlation of timescale with pitch. In that regime it appears that a "history-independent" model can successfully predict the temperature profile.
- Outside that pitch range, there is clearly a wide range of timescales associated with a particular pitch. Description of two specific cases is given below, apparently implicating the thermal history, although not in a way that is predictively useful.
- Near pitch=50, there is a radical difference between the heating timescale (red points) and the cooling timescale (black points). What does this imply??
Small pitch change can imply large timescale change
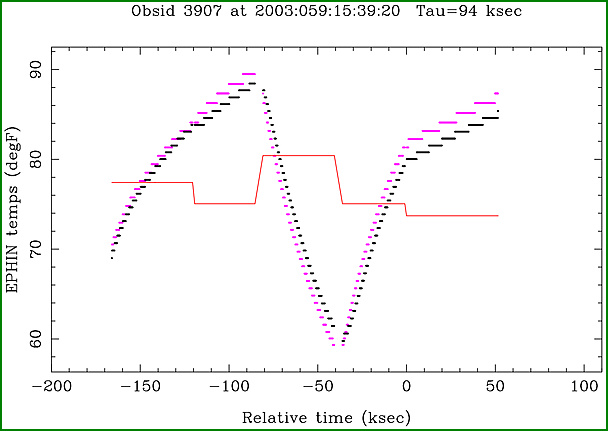
The plot below for obsid 3907 illustrates the radical change in time constant given a relatively small change in pitch (from about 68 to 88 degrees). The roll angle in both is near nominal . Encouragely, the extrapolated TEPHIN for both 3907 and obsid 4421 (the preceding observation with a short timescale showing a rapid rise) come out to very similar value (308 K).In this plot, TEPHIN is shown in magenta and 5EPHINT in black. The red line indicates the pitch angle, where the full scale goes from 45 to 180 degrees. The obsid in question (3907) starts at T=0 ksec, while 4421 ends at T=0 ksec.
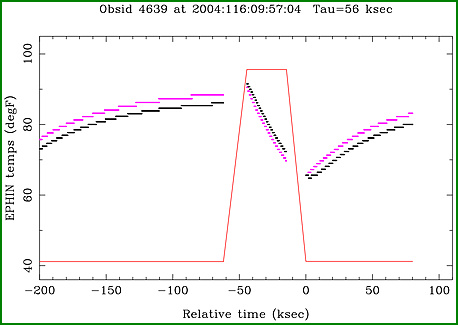
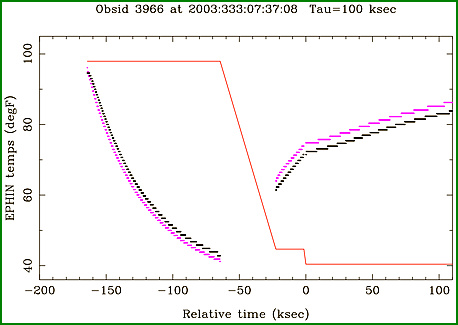
Three very different timescales near pitch=50
The three plots below show three observations all taken near a pitch angle of 50 and within a year of each other. The derived thermal timescales in these cases are 17, 56, and >100 ksec, respectively. The point here is that in these cases, thermal history appears to have a large impact on the timescale, though not the final limiting temperature.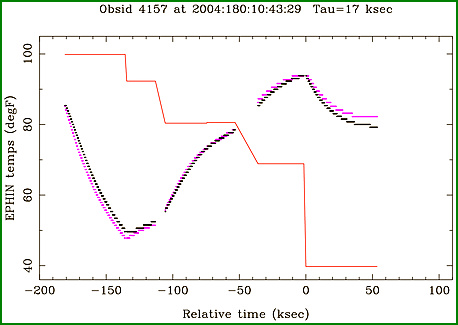
Two different timescales near pitch=145
In the two examples below, we see temperature histories for two obsids very near pitch=145, taken within a few months of each other. The thermal timescales are 36 and >100 ksec. What makes these discrepancies interesting is the qualitative similarity in the thermal history. (Note that the gaps are because my processing does not include dwells less than 20 ksec long).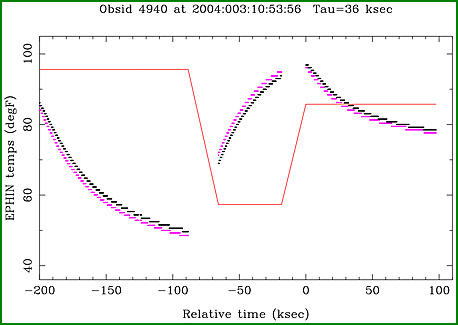
5EPHINT time scale and correlation with TEPHIN
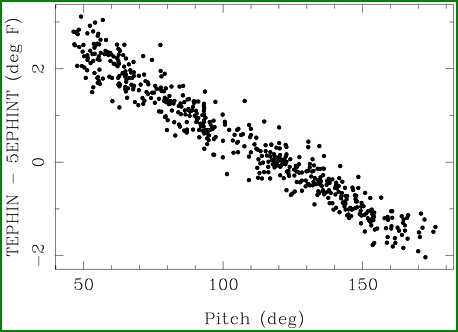
The 5EPHINT telemetry measures the actual detector temperature, and is a better indicator for an EPHIN rail voltage anomaly. In a number of cases one observes a rapid response of 5EPHINT (less than about 30 ksec), followed by a period in which the 5EPHINT simply tracks TEPHIN. This implies that the detector thermal time constant is actually short and that the housing is driving the system. (Does this make physical sense given the relative masses etc?)The limiting difference in temperature is shown in the plot below. Note that this was made using the final 100 seconds of data for each observation and does not rely on any fitting. There is a simple and reliable relationship as a function of pitch between the two temperatures:
Aspect Information main page
Comments or questions: Aspect Help
Last modified:12/27/13