Summary
Data for approximately 5700 stars observed with the ACA show that there is no mean offset between observed and AGASC catalog magnitudes. There is no correlation in magnitude difference with either magnitude or time. There is a noticable systematic residual (about +/- 0.2 mags) in magnitude difference versus (B-V) color. Analysis of the distribution of magnitude differences shows that they are non-gaussian. The absolute value of magnitude difference is distributed as follows:| 68% | < 0.20 mags |
| 95% | < 0.80 mags |
| 99.7% | < 1.62 mags |
- For star acquisition, a magnitude pad of 1.5 mags will result in failed acquisition for less than 4 of 1000 stars
- For star selection, the formal 3-sigma error (with no systematic term) is typically ~0.75 to 0.9 mags. Using this padding for both candidate and spoiler stars gives about (1-0.95)^2 = 0.25% chance of a magnitude overlap. (Note that this is based purely on statistics of guide stars -- random field stars may have a somewhat different distribution).
Data processing
Using a GRETA script, flight ACA data were extracted for about 8400 stars observed with the ACA from 1999-Sep to 2000-Oct. (Thanks to Jeff Shirer for creating and running the script). The data consist of star image slot, position in ACA angle, and magnitude statistics: mean, median, standard deviation, 5th percentile, 95th percentile, and number of samples. These data were then correlated with CXC Level 1 aspect products to determine AGASC catalog information for each star. Approximately 5700 stars were thus identified. The majority of non-identified stars are in non-science obsids for which no Aspect L1 products are available.Magnitude difference versus color, magnitude, and date
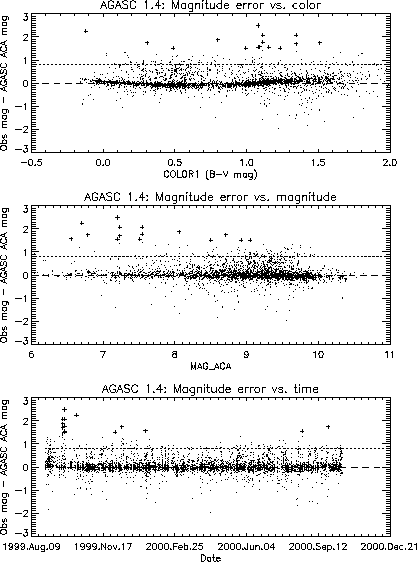
The plots below show magnitude difference (always mean observed magnitude minus AGASC magnitude) as a function of color (typically B-V from the AGASC), AGASC magnitude, and date. Horizontal lines are drawn at 0.0 mags and 0.8 mags to guide the eye. In addition, all points with a magnitude difference greater than 1.5 mags (corresponding to possible non-acquisition) have been drawn with a "+" symbol. It is not immediately clear why these stars were acquired, and investigation into the exact star catalog used is needed.

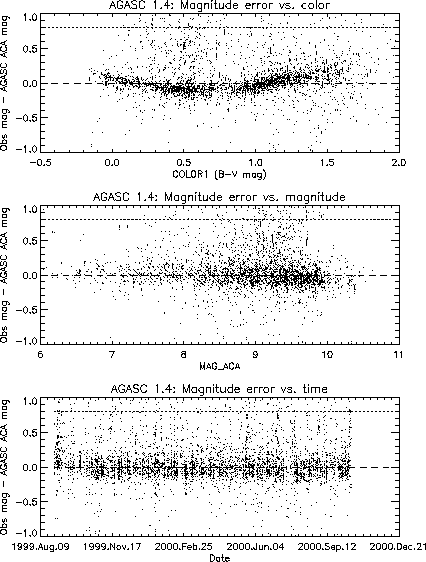
The next set of plots below are the same as above, but zoomed in to emphasize deviations near zero. The key feature is the systematic trend of magnitude errors as a function of color.

Distribution of magnitude difference
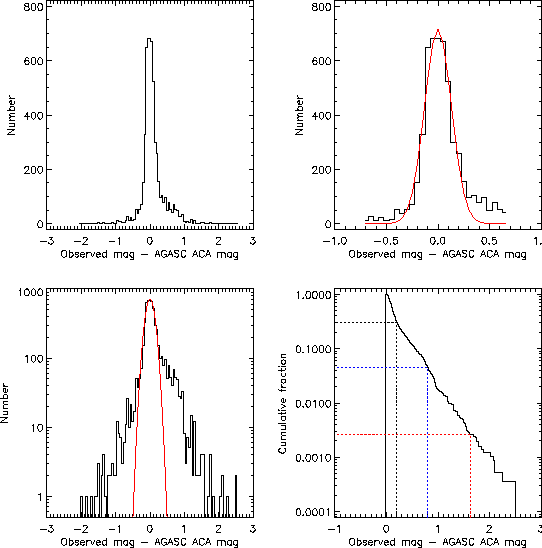
The four plots below show the distrbution of magnitude differences for the 5700 stars points.- The upper left plot simply shows a linear histogram of differences.
- The upper right plot is the same histogram, but zoomed in to +/-0.7 mag.
- The curve in red is the best-fit gaussian, where only points within the +/-0.7 mag range were used.
- The lower left
shows the same histogram of differences, but in log space. The
non-gaussian nature of the distribution is clearly evident. Finally,
the lower right plot shows the cumulative distribution of the absolute
value of the magnitude difference. The black, blue, and red dotted
lines mark radii containing 68%, 95%, and 99.7% of points,
respectively.
68% < 0.20 mags 95% < 0.80 mags 99.7% < 1.62 mags

Tom Aldcroft Last modified: 01/26/01