Aspect Trending (updated Tue Apr 4 14:35:32 2023)
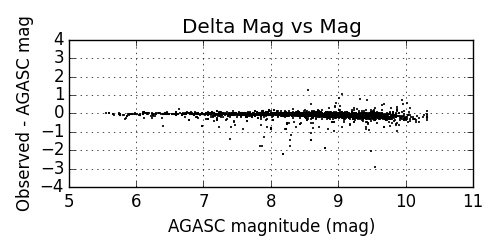
Acq Stats Report - 2023-Q2
https://cxc.cfa.harvard.edu/mta/ASPECT/acq_stat_reports/2023/Q2/
2023-Feb-01 through 2023-May-01
| TSTART | TSTOP |
|---|
| 2023:032:00:00:00.000 | 2023:121:00:00:00.000 |


| failed_acq |
|---|
| N Stars | stars | rate |
|---|
| 10.0-10.1 | 35 |
9 |
0.26 |
| 10.1-10.2 | 29 |
8 |
0.28 |
| 10.2-10.3 | 18 |
4 |
0.22 |
| 10.3-10.4 | 10 |
3 |
0.30 |
| 10.4-10.5 | 6 |
3 |
0.50 |
| 10.5-10.6 | 6 |
1 |
0.17 |
| 10.6-10.7 | 0 |
0 |
0.00 |
| 10.7-10.8 | 3 |
2 |
0.67 |
| 10.8-10.9 | 0 |
0 |
0.00 |
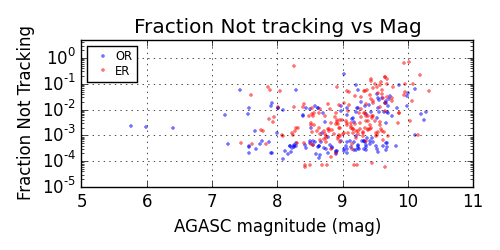
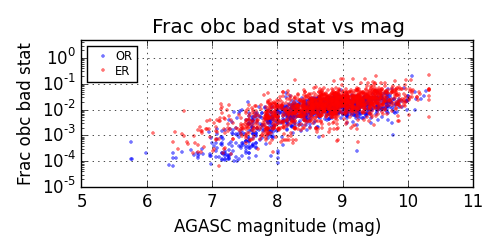
Guide Stats Report - 2023-Q2
https://cxc.cfa.harvard.edu/mta/ASPECT/gui_stat_reports/2023/Q2/
2023-Feb-01 through 2023-May-01
| TSTART | TSTOP |
|---|
| 2023:032:00:00:00.000 | 2023:121:00:00:00.000 |
|
bad_track |
no_track |
obc_bad_status |
|---|
|
N Stars |
stars |
rate |
stars |
rate |
stars |
rate |
|---|
| 10.0 - 10.1 |
2 |
0 |
0.000 |
0 |
0.000 |
0 |
0.000 |
| 10.1 - 10.2 |
4 |
2 |
0.500 |
0 |
0.000 |
0 |
0.000 |
| 10.2 - 10.3 |
1 |
0 |
0.000 |
0 |
0.000 |
1 |
1.000 |
| 10.3 - 10.4 |
0 |
0 |
0.000 |
0 |
0.000 |
0 |
0.000 |
| 10.4 - 10.5 |
0 |
0 |
0.000 |
0 |
0.000 |
0 |
0.000 |
| 10.5 - 10.6 |
0 |
0 |
0.000 |
0 |
0.000 |
0 |
0.000 |
| 10.6 - 10.7 |
0 |
0 |
0.000 |
0 |
0.000 |
0 |
0.000 |
| 10.7 - 10.8 |
0 |
0 |
0.000 |
0 |
0.000 |
0 |
0.000 |
| 10.8 - 10.9 |
0 |
0 |
0.000 |
0 |
0.000 |
0 |
0.000 |
Periscope Trending Report - 2023-Q2
https://cxc.cfa.harvard.edu/mta/ASPECT/periscope_drift_reports/2023/Q2/
2023-Feb-01 through 2023-May-01
| TSTART | TSTOP |
|---|
| 2023:032:00:00:00.000 | 2023:121:00:00:00.000 |
Histogram of periscope drift in arcsecs

Obsid with largest periscope drift this interval
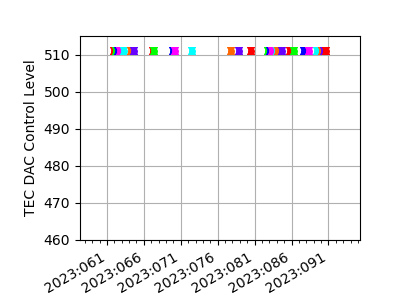
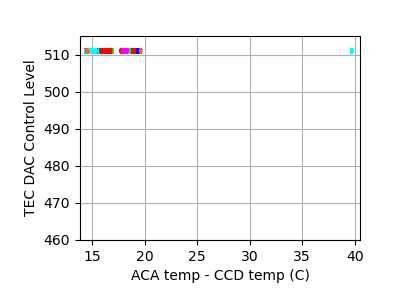
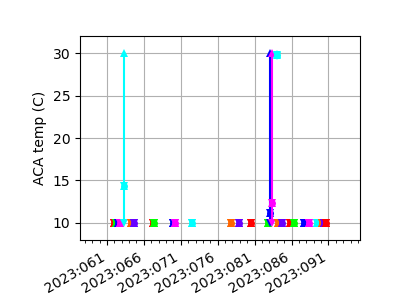
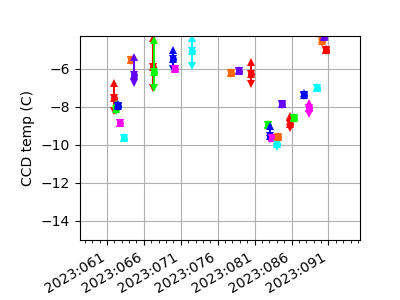
2023-M03, ACA Health Summary Plots
https://cxc.cfa.harvard.edu/mta/ASPECT/perigee_health_plots/SUMMARY_DATA/2023-M03/
Summary plots of ACA housing temperature, CCD temperature, and DAC
control level. Data is only available during perigee passes, so each
point on these summary plots represents the mean of the aforementioned
indicators during a perigee pass. Plots for single passes are
available from the links below.
Kalman star watch
https://cxc.cfa.harvard.edu/mta/ASPECT/kalman_watch3/
Summary
The plot below shows intervals where the number of Kalman stars
reported by the OBC
(AOKALSTR) was zero or one for at least four updates. Intervals
in the last 30 days are plotted in orange.
| Date |
Duration |
Obsid |
Comment |
| 2023:075:17:45:35.573 |
31.8 |
27724 |
MUPS-B checkout |
| 2023:074:11:43:03.715 |
31.8 |
27724 |
SCS107 (Radiation) |
| 2023:074:11:39:11.040 |
31.8 |
27724 |
SCS107 (Radiation) |
| 2023:058:03:20:21.895 |
31.8 |
25892 |
SCS107 (Radiation) |
| 2023:058:03:16:17.945 |
31.8 |
25892 |
SCS107 (Radiation) |
| 2023:047:06:14:08.417 |
30.8 |
0 |
Safe Mode |
| 2023:040:15:31:43.726 |
31.8 |
27160 |
MUPS-A A4 checkout |
| 2022:301:09:43:42.903 |
31.8 |
27520 |
ACA high background |
| 2022:301:09:41:48.103 |
31.8 |
27520 |
ACA high background |
| 2022:231:18:42:31.755 |
31.8 |
45317 |
CTU reset => NSM |
| 2022:224:02:18:45.837 |
31.8 |
45339 |
BSH recovery |
| 2022:224:02:17:32.037 |
32.8 |
45339 |
many repeats... |
| 2022:224:01:42:42.062 |
31.8 |
45339 |
BSH recovery |
| 2022:223:13:46:17.662 |
31.8 |
45339 |
High IR zone => BSH |
| 2022:215:15:25:37.699 |
31.8 |
45357 |
High IR zone |
| 2022:087:12:45:37.583 |
31.8 |
24252 |
SCS107 (Radiation) |
| 2022:040:17:55:32.208 |
31.8 |
25445 |
SCS107 (HRC Anomaly) |
| 2021:301:16:41:03.333 |
31.8 |
26166 |
SCS107 (Radiation) |
| 2021:301:16:37:12.708 |
29.7 |
26166 |
SCS107 (Radiation) |
| 2021:244:10:39:09.658 |
31.8 |
24520 |
SCS107 (Manual / LETG Anomaly) |
| 2020:237:15:12:17.434 |
31.8 |
22652 |
Related to HRC Anomaly |
| 2020:237:15:08:15.534 |
31.8 |
22652 |
Related to HRC Anomaly |
| 2020:079:18:02:44.784 |
31.8 |
21167 |
HighBgd |
| 2019:353:19:08:01.616 |
31.8 |
22643 |
HighBgd |
| 2019:251:00:51:39.841 |
31.8 |
47909 |
MUPS Checkout |
| 2019:248:16:46:34.316 |
31.8 |
47912 |
HighBgd |
| 2018:293:02:01:25.618 |
41.0 |
62658 |
Mixed IRU Setup |
| 2018:293:01:57:48.318 |
31.8 |
62658 |
Mixed IRU Setup |
| 2018:149:15:13:34.193 |
31.8 |
20980 |
HighBgd |
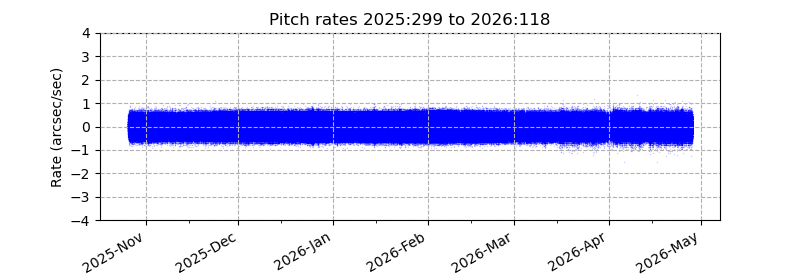
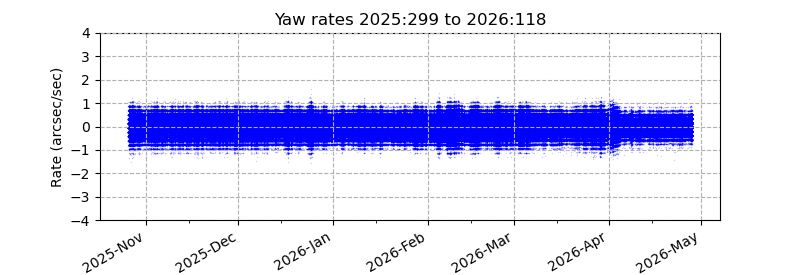
OBC rate noise trending
https://cxc.cfa.harvard.edu/mta/ASPECT/obc_rate_noise/trending/

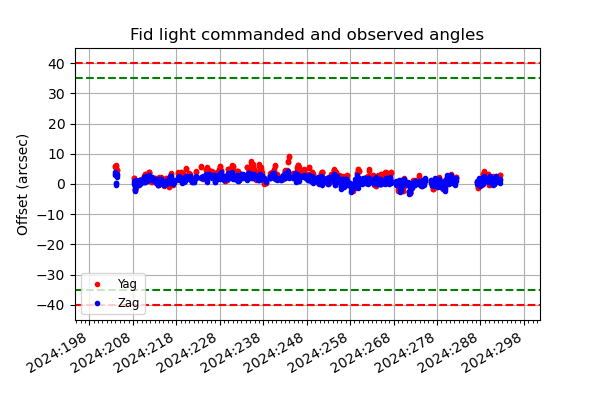
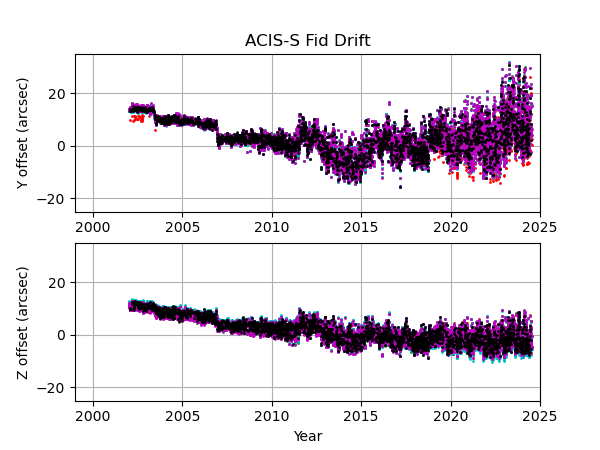
Fiducial light drift
https://cxc.cfa.harvard.edu/mta/ASPECT/fid_drift/
Fid light drifts (Updated 04/04/23)
The data for these plots were generated by extracting Aspect L1
centroid data and fid properties data for all archived observations.
The last 4 ksec of data are used, to minimize scatter due to thermal
transients. Then a median centroid position is calculated for each
fid light. Finally, for each science instrument and fid light, the
"drift" is calculated by removing both the mean centroid for that fid
light (over observations in early 2003) and the SIM-Z offset (for
that observation).
In the plots below, different colors and symbols represent the different fid
lights for each SI.
Chandra Aimpoint Trending
https://cxc.cfa.harvard.edu/mta/ASPECT/aimpoint_mon/
Observed aimpoint differences trend
The following plot shows the difference in CHIPX and CHIPY between the planned observation
aimpoint and the actual aimpoint. The planned aimpoint is computed using the planned
aimpoint chip coordinates (CHIPX/Y) and observer target offsets and the SIM-Z position.
The actual aimpoint is computed using
dmcoords
and keyword values from the CXC
archive L2 X-ray event file. The plot shows up to 6 months of data starting from when
dynamic aimpoints were initially put into use (AUG2916 schedule).
Intra-observation aimpoint drift
During an observation the aimpoint can drift, and this is illustrated in the plot below.
However, from the perspective of planning observations this need not be
considered because it is
already included
in the
Aimpoint
Trending
plots. This is because those plots sample from 1 ksec intervals within
every science observation (instead of per-observation means), thus picking up the extremes.
Offsets After Reprocessing
https://cxc.cfa.harvard.edu/mta/ASPECT/celmon/
Off-axis sources or observations with non-zero SIM offset
The absolute positional accuracy of source coordinates in Chandra observations is estimated
measuring the angular offset between Chandra X-ray source
positions and corresponding optical/radio counterpart positions
from accurate catalogs .
The time-history of
offsets for recent Chandra observations is shown below.
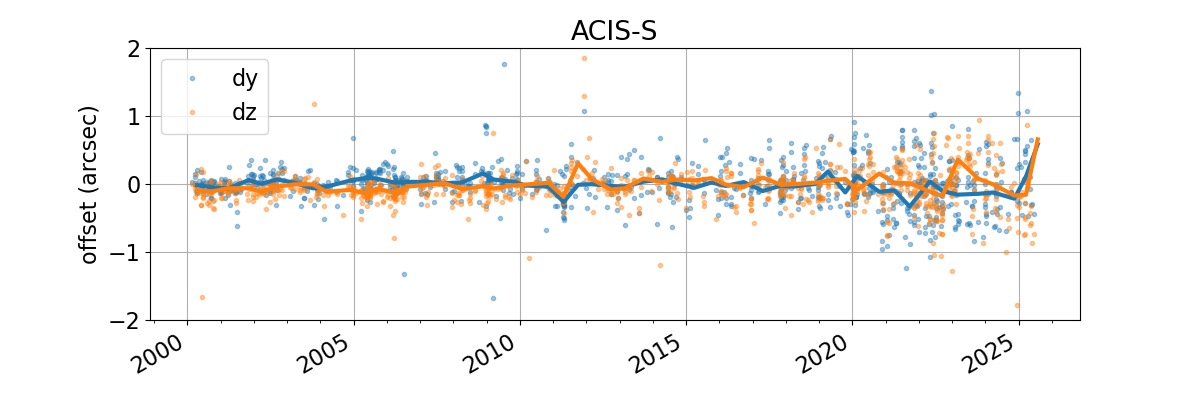

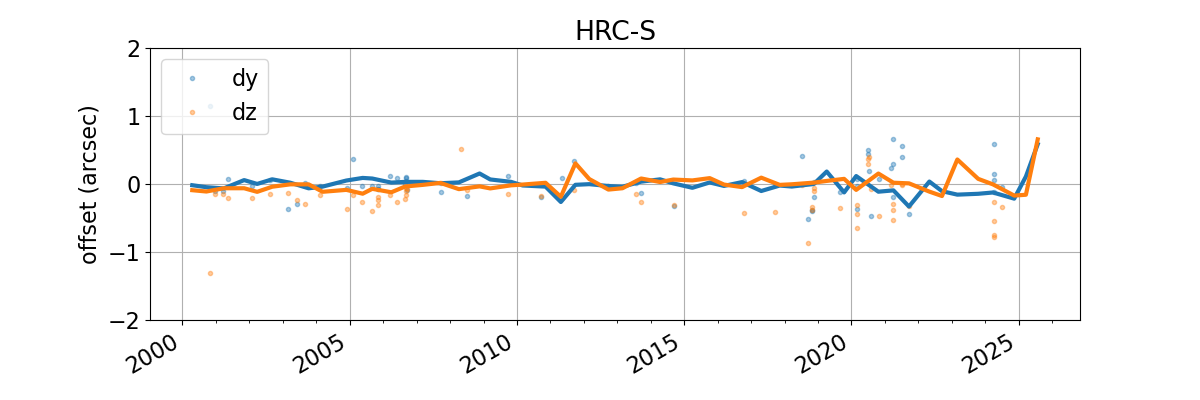
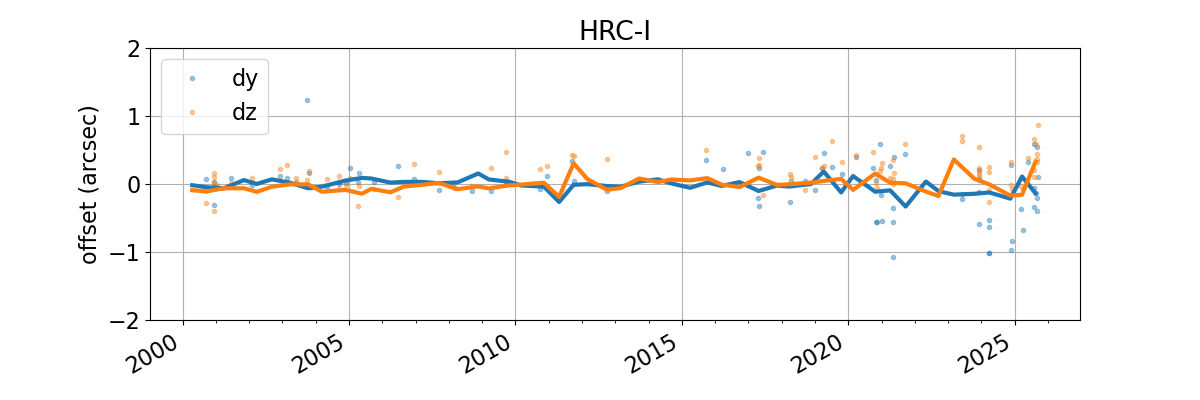
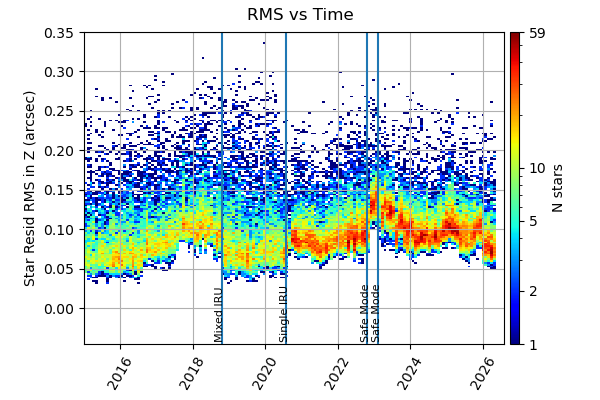
Image Reconstruction Trending
Pipeline residual RMS (updated
04/04/23)
https://cxc.cfa.harvard.edu/mta/ASPECT/vv_rms/
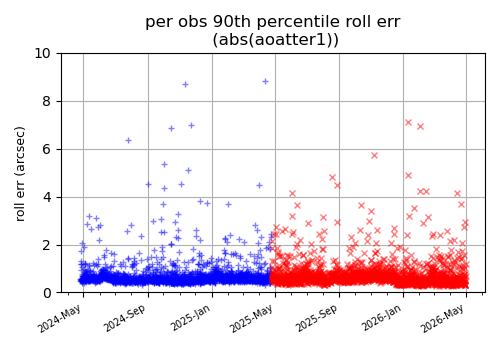
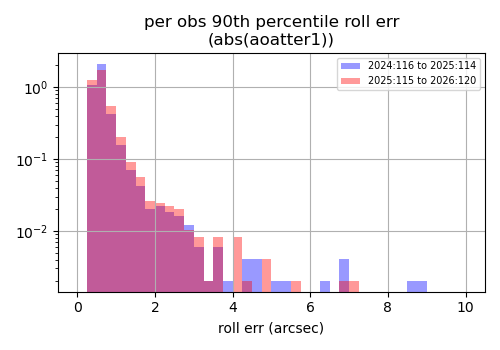
One shots and attitude errors
(Updated
04/04/23)
https://cxc.cfa.harvard.edu/mta/ASPECT/attitude_error_mon/
One shots from 2022:034:19:40:11.640
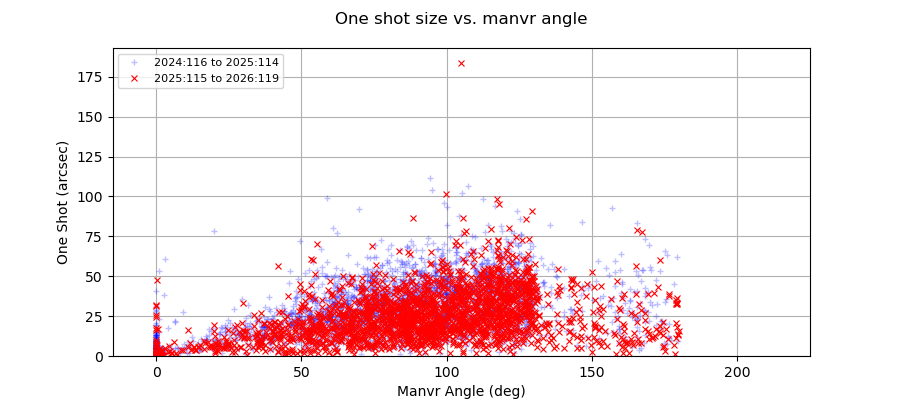
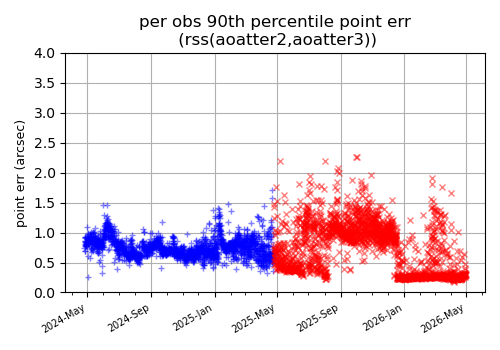
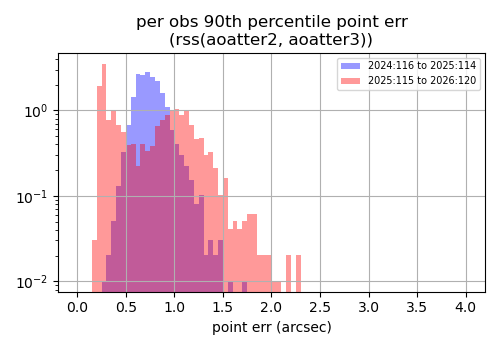
Attitude errors (from AOATTER1,2,3) for dwells >= than 1ks.
Note that in addition to filtering on dwell duration (>= 1ks) these data have also been filtered to
remove dumps, tsc moves, and intervals marked as ltt_bads.
FSS Performance Trending
https://cxc.cfa.harvard.edu/mta/ASPECT/fss_check3/
Table of samples with sun presense and alpha_err > 2.0 deg
| FSS-Primary (1 year) | FSS-Primary (90 days) |

|

|

|

|