| One Week Plot | Three Month Plot | One year Plot | Five Year Plot | Full Range | Min | Mean | Max |
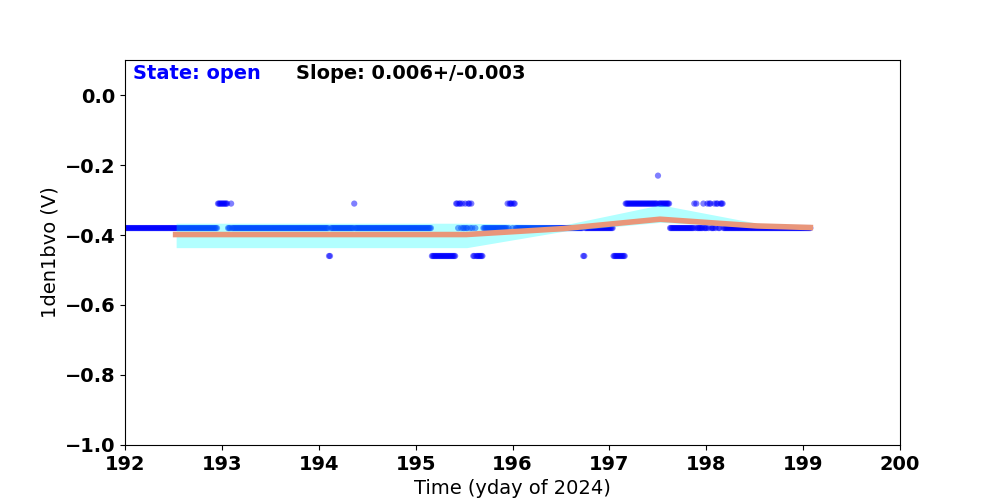
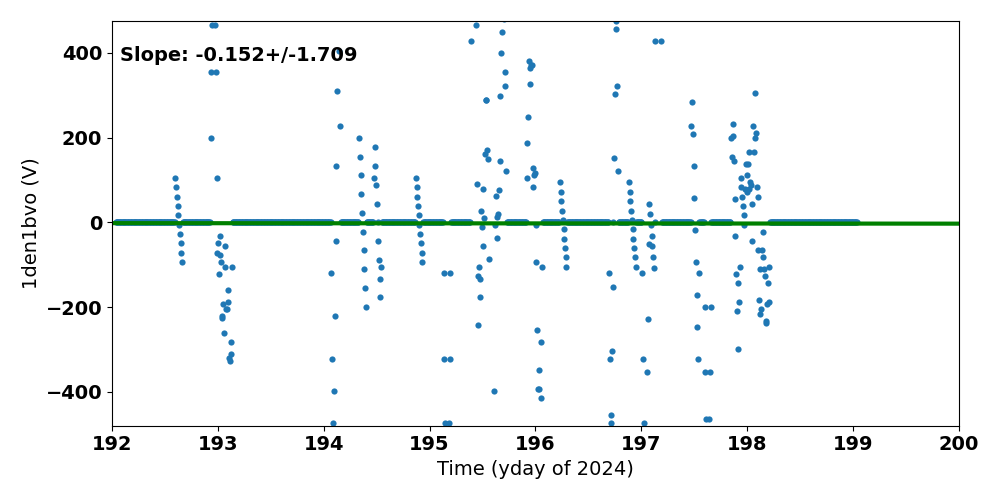
| 1dahbcu | 1dahbvo | 1dahhbvo | 1de28bvo | 1deicbcu | 1den0bvo | 1den1bvo | 1dep0bvo | 1dep1bvo | 1dep2bvo | 1dep3bvo | 1dp28bvo |
| 1dpicbcu | 1dpp0bvo |
If you have any questions, please contact
swolk@cfa.harvard.edu.
Data Updated: Jul 28, 2026
Last Site Modification: Sep 30, 2021