| One Week Plot | Three Month Plot | One year Plot | Five Year Plot | Full Range | Min | Mean | Max |
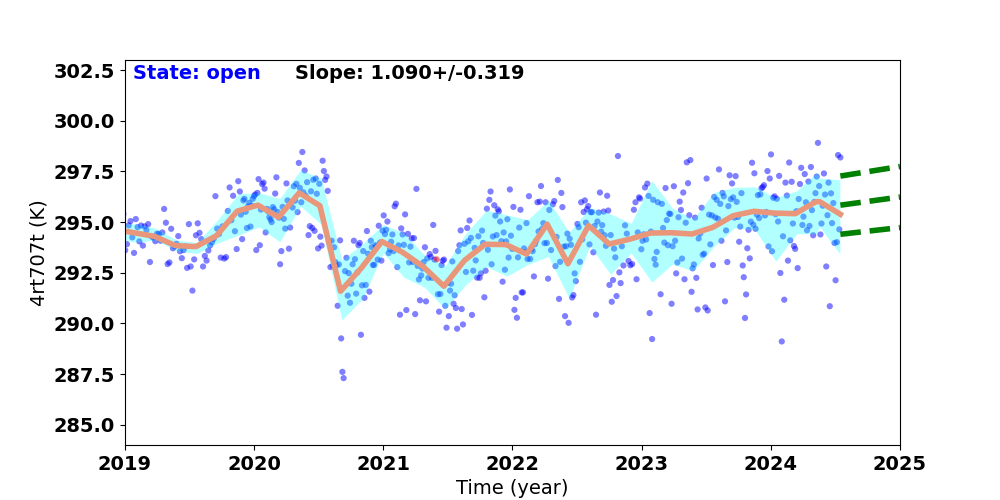
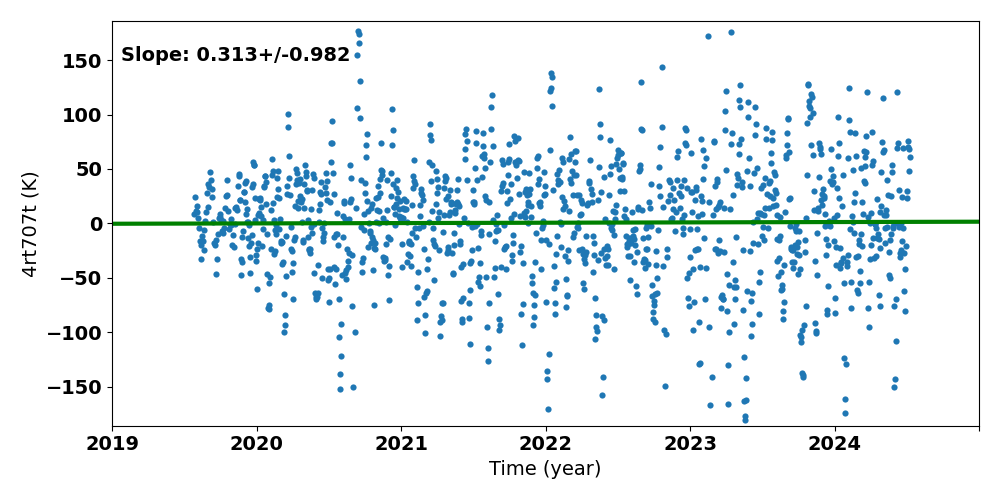
| 4rt700t | 4rt701t | 4rt702t | 4rt703t | 4rt704t | 4rt705t | 4rt706t | 4rt707t | 4rt708t | 4rt709t | 4rt710t | 4rt711t |
If you have any questions, please contact
swolk@cfa.harvard.edu.
Data Updated: Jul 16, 2026
Last Site Modification: Sep 30, 2021