| One Week Plot | Three Month Plot | One year Plot | Five Year Plot | Full Range | Min | Mean | Max |
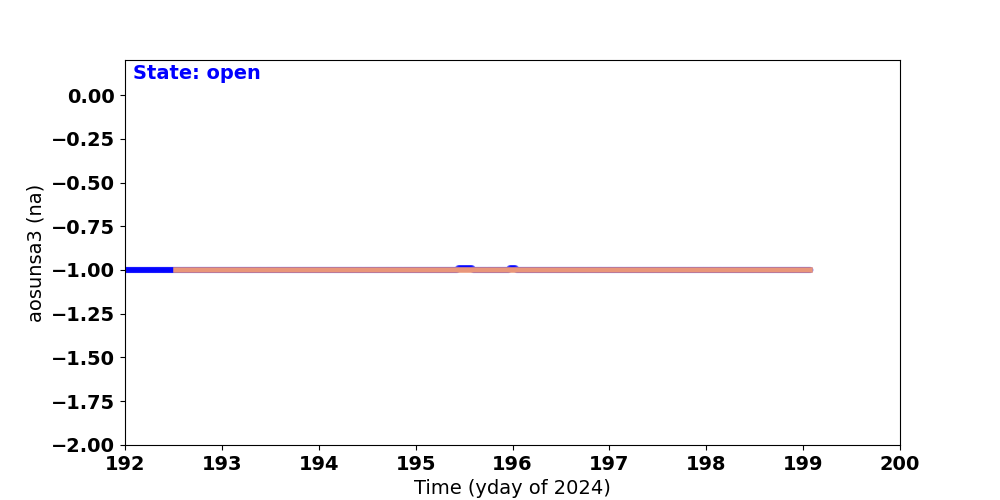
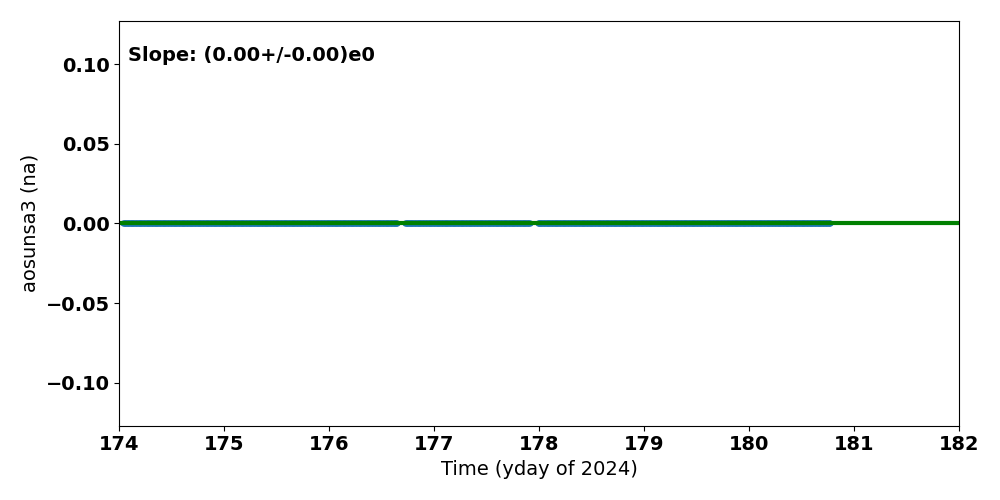
| aosunsa3 | aotarqt2 | c05palv | c15nalv | c15palv | c24palv | fe00atm | fepratm | imhvatm | iminatm | lvplatm | prbscr |
| prbsvl | smtratm | sphvatm | spinatm |
If you have any questions, please contact
swolk@cfa.harvard.edu.
Data Updated: Jul 14, 2026
Last Site Modification: Sep 30, 2021