| One Week Plot | Three Month Plot | One year Plot | Five Year Plot | Full Range | Min | Mean | Max |
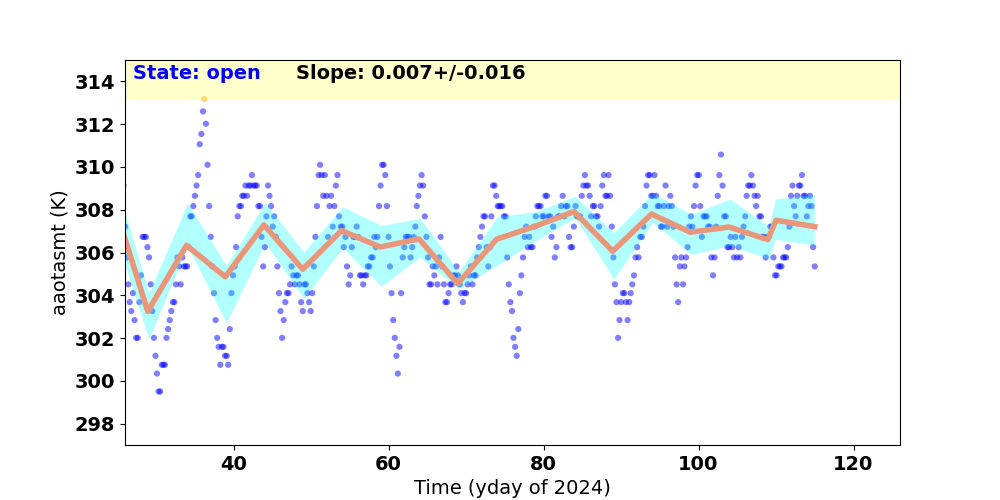
| aacbppt | aacbprt | aacccdpt | aacccdrt | aach1t | aach2t | aaotalt | aaotapmt | aaotasmt | aaoth2mt |
If you have any questions, please contact
swolk@cfa.harvard.edu.
Data Updated: Jul 24, 2026
Last Site Modification: Sep 30, 2021