| One Week Plot | Three Month Plot | One year Plot | Five Year Plot | Full Range | Min | Mean | Max |
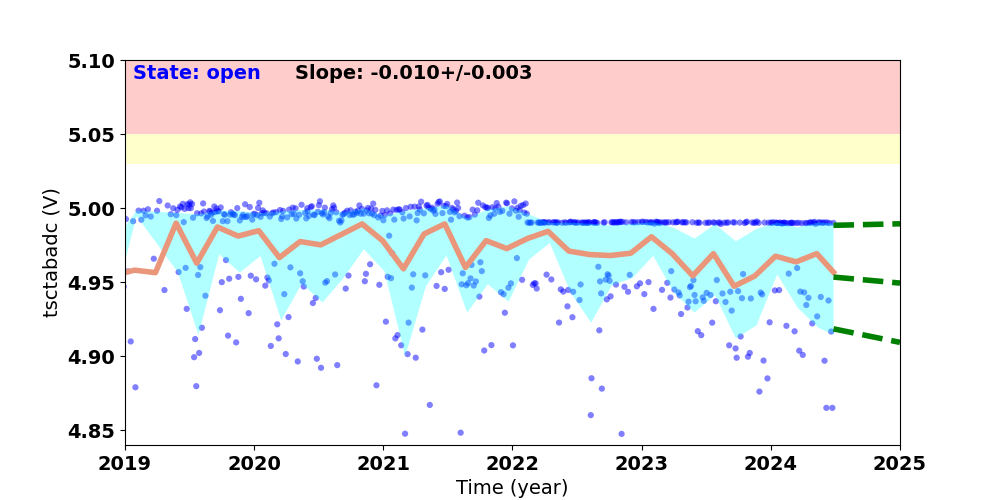
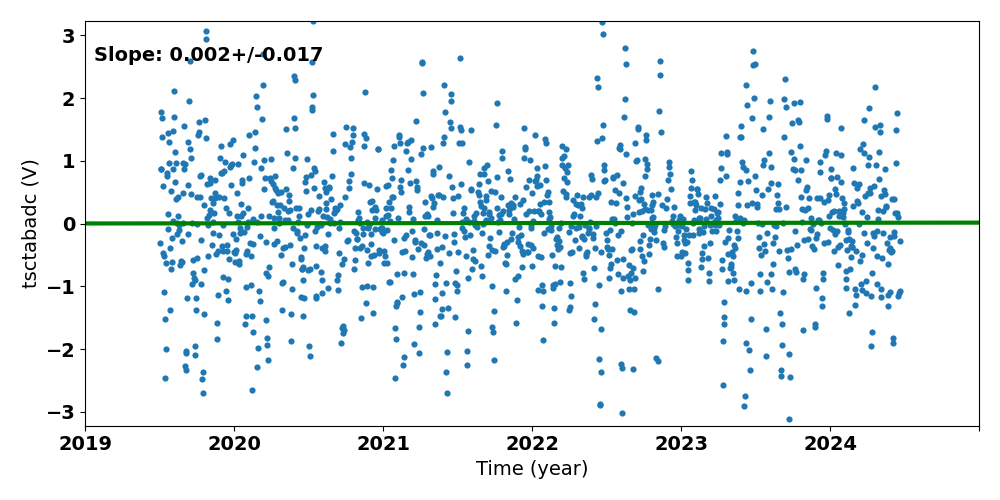
| 4rt570t | 4rt578t | agrndadc | fatabadc | n15vadc | p15vadc | p5vadc | tsctabadc |
If you have any questions, please contact
swolk@cfa.harvard.edu.
Data Updated: Jul 21, 2026
Last Site Modification: Sep 30, 2021