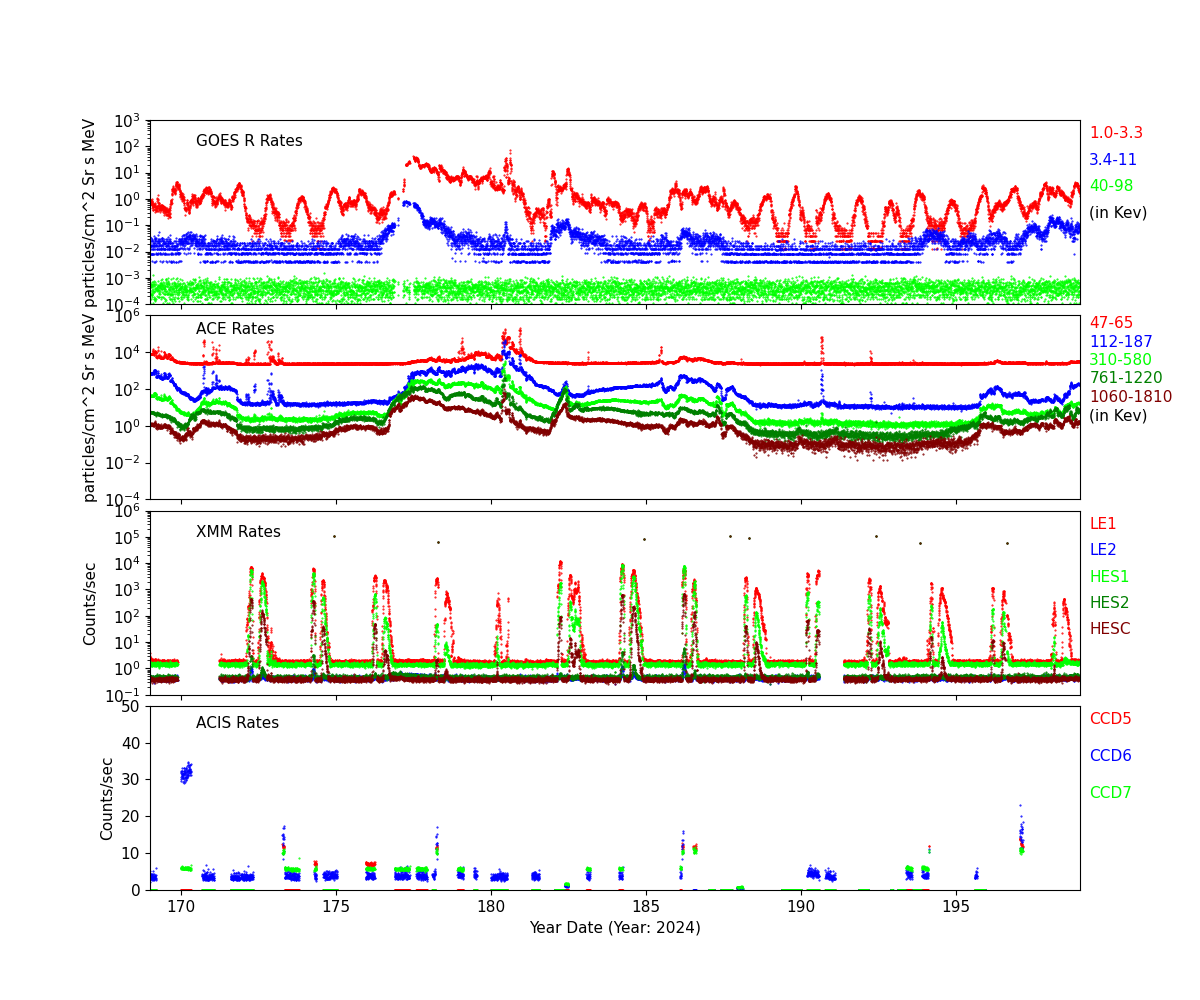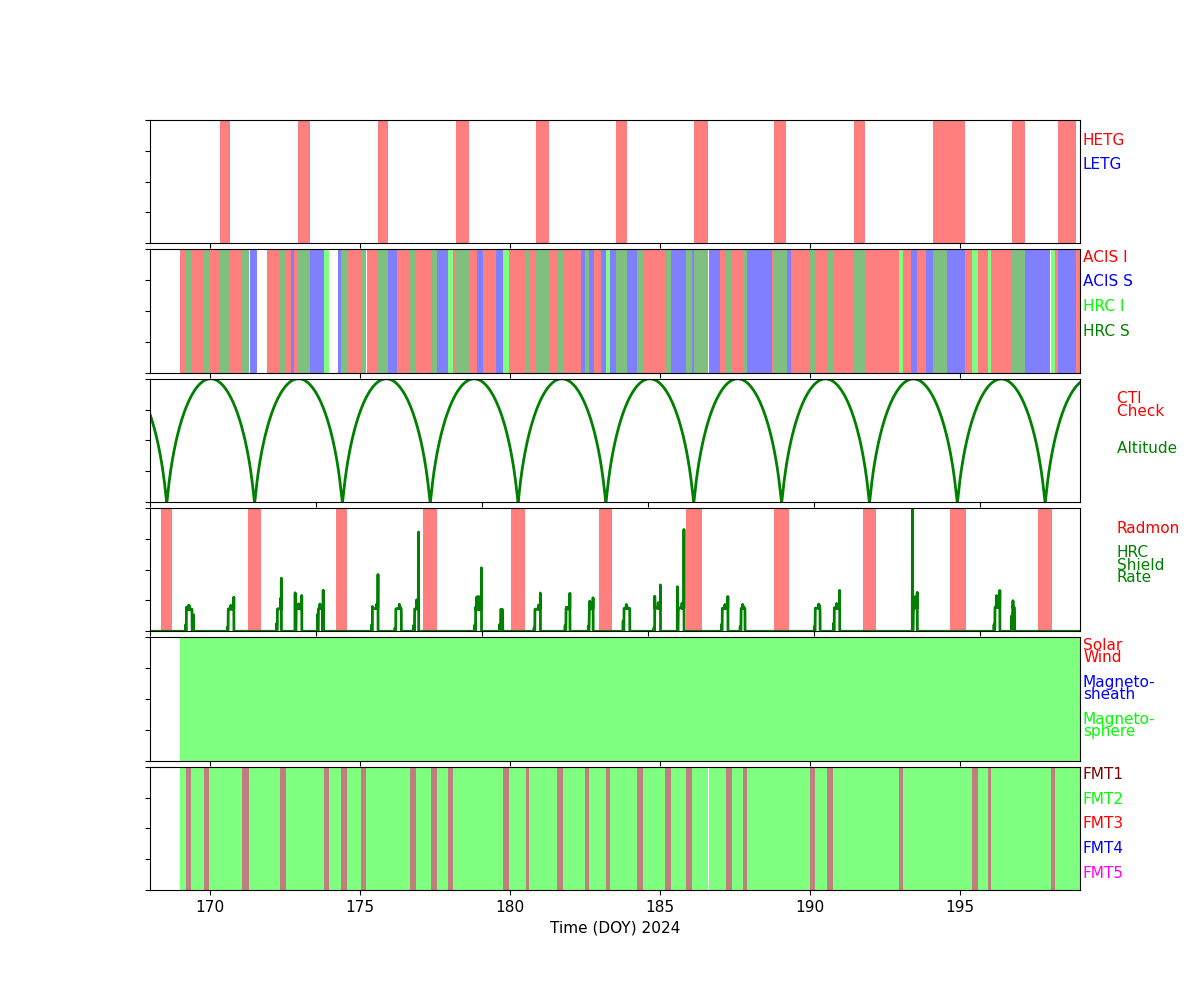

GOES Primary, ACE, EPHIN, and ACIS count rates plotted on the same time scale. Also shown on the same timescale is a stripchart of Chandra configuration.
Note: GOES plot changed from Mar 01, 2020 due to the change of the satellite. The energy bands are different and the rate ranges are quite different before and after Mar 2020.
If you have any questions about this page, please contact swolk@cfa.harvard.edu